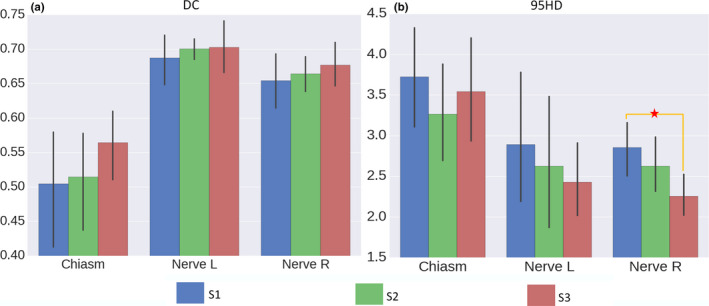
Figure 6.

The DC (a) and the 95HD (b) scores for S1, S2, and S3. The S2/S3 strategy proves to be effective, as both S2 and S3 yield higher DC scores and lower 95HD scores than S1. The proposed joint segmentation strategy (S3) proves to be more effective than S2, as better scores can be achieved. The asterisks denote statistical significance (i.e., P < 0.05 in t tests). [Color figure can be viewed at wileyonlinelibrary.com]
