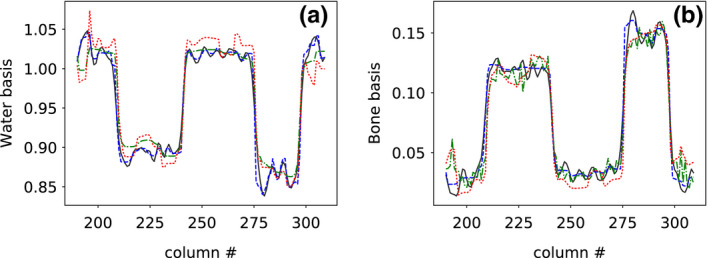
Figure 11.

Profile plots of (a) water‐basis and (b) bone‐basis images across the dashed line indicated in water‐basis image (column (a), row 1) of Fig. 9 for reference basis image (solid) and basis images reconstructed from full‐ (dashed), short‐ (dashed‐dotted), and half‐scan (dotted) data, respectively. [Color figure can be viewed at wileyonlinelibrary.com]
