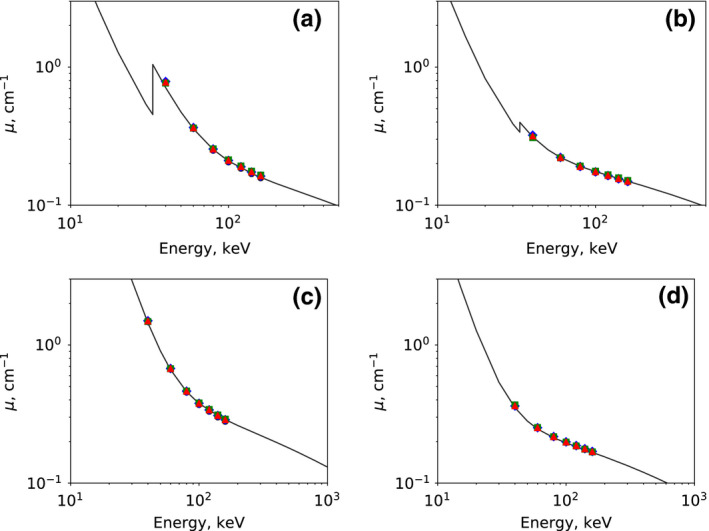
Figure 13.

Linear‐attenuation coefficients as functions of energy plotted in a log‐log scale, for (a) the 20‐mg/ml and (b) the 2‐mg/ml iodine inserts and for (c) the 600‐mg/ml and (d) the 50‐mg/ml calcium inserts. The solid curves represent ground‐truth values calculated from NIST data,27 along with linear‐attenuation coefficient calculated from monochromatic images at 40, 60, 80, 100, 120, 140, and 160 keV reconstructed from full‐ ( ), short‐ (
 ), and half‐scan (
 ) data, as well as from the reference images (
 ). The vertical bars through the symbols indicate the standard deviations estimated within the ROI of each insert. [Color figure can be viewed at wileyonlinelibrary.com]
