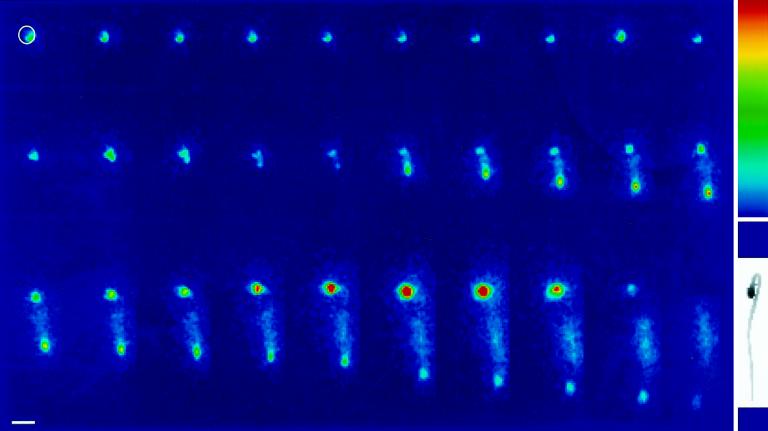
Figure 1.
ZPT2-2::LUC activity in a germinating petunia seed. A seed from a ZPT2-2::LUC transformant was imbibed in 0.5 mm luciferin. Individual images of in vivo LUC activity were obtained by integration of photon production during 30 min. Consecutive images were obtained over a 3-d period. Selected images are shown (time interval between images is 2 h). The white circle in the first image indicates the size of the petunia seed. Note the elevated LUC activity in the root tip and the transient increase in LUC activity in the cotyledons of the seedling. Inset top right, Color scale used for the representation of LUC activity. The color scale ranges from 0 (blue) to 256 (red) relative units of LUC activity. Inset bottom right, Light image of the seedling. Space bar =1 mm.

