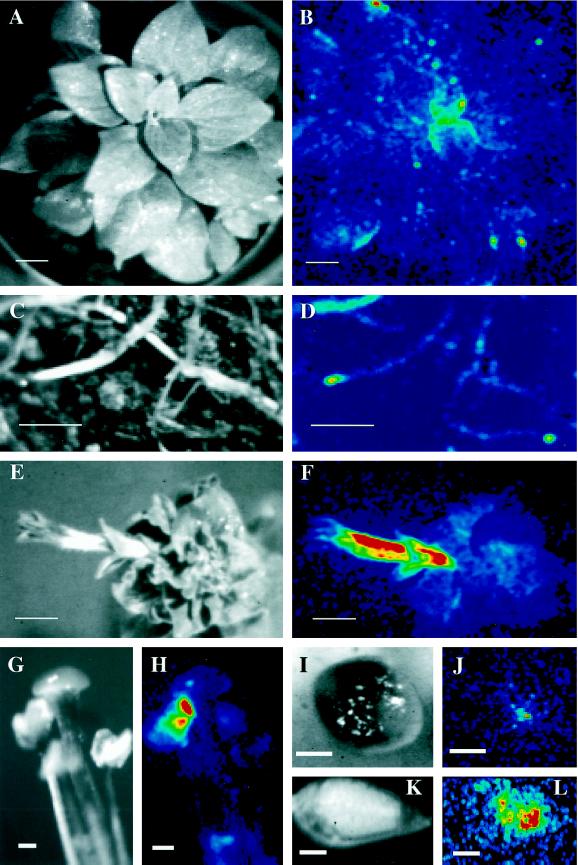
Figure 2.
In vivo ZPT2-2::LUC activity in vegetative and flowering plants. A plant expressing the ZPT2-2::LUC gene was repeatedly sprayed with luciferin, after which the in planta LUC activity was imaged during a 20-min interval. Light images, A, C, E, G, I, and K. ZPT2-2::LUC activity images, B, D, F, H, J, and L. The LUC activity is represented in a false color scale ranging from 0 to 256 (see legend to Fig. 1). A and B, Vegetative shoot (plant 4 weeks old); C and D, roots (plant 4 weeks old); E and F, inflorescence (plant 6 weeks old); G and H, stamen and style; I and J, transgenic pollen on non-transgenic stigma; K and L, developing seeds 5 d post pollination. Thick space bars = 1 mm; thin space bars = 1 cm. Note that the resolution of the images is limited by the resolution of the intensifier (350 × 350 dpi).

