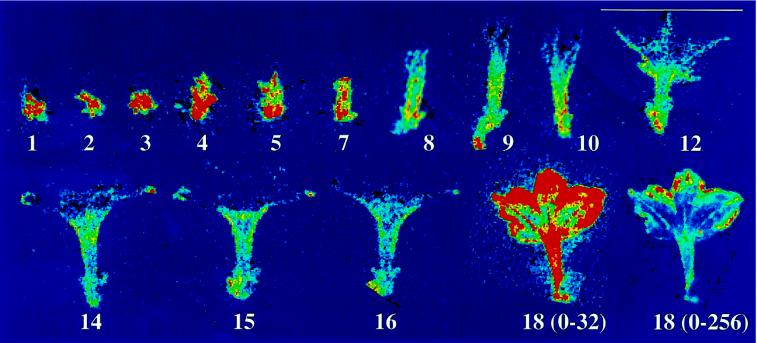
Figure 3.
ZPT2-2::LUC activity in the same flower during 18 d of development on the plant. A ZPT2-2::LUC plant was sprayed daily with luciferin and LUC activity was imaged in the same floral bud during a 30-min interval over an 18-d period. Numbers correspond to the day at which the image was taken. The LUC activity is represented in false colors (scale 0–16; see legend to Fig. 1). The last image (d 18) is shown twice, once in scale 0 to 16 and once in scale 0 to 256.

