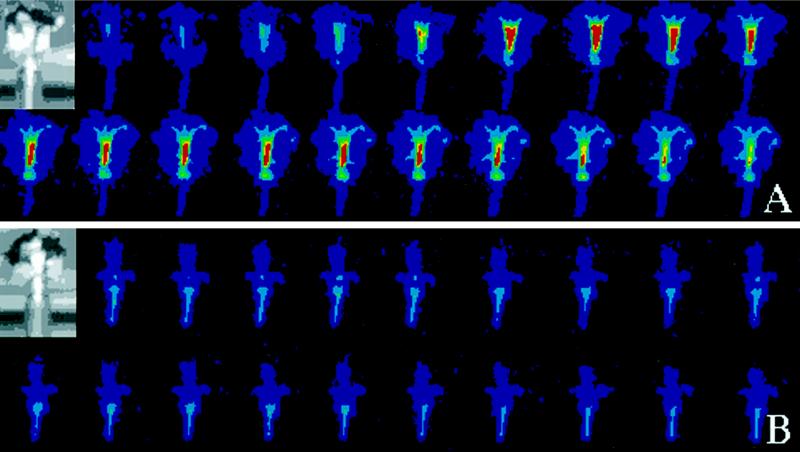
Figure 4.
ZPT2-2::LUC activity in petals in response to pollination. A flower from a ZPT2-2::LUC plant was harvested prior to anthesis and put in a small vase with 0.1 mm luciferin (A) or 0.1 mm luciferin plus 0.1 mm STS (B). After 12 h of equilibration, the flowers were pollinated and in vivo LUC activity was imaged in 30-min intervals during a 3-d period. The time interval between the images was 3.5 h. The LUC activity is represented in false colors (color scale range from 0–256; see legend to Fig. 1). Note that the transient increase in LUC activity in the tube and corolla tissue (A) is blocked by the STS treatment (B). The insets show the light images of the flowers in the vase.

