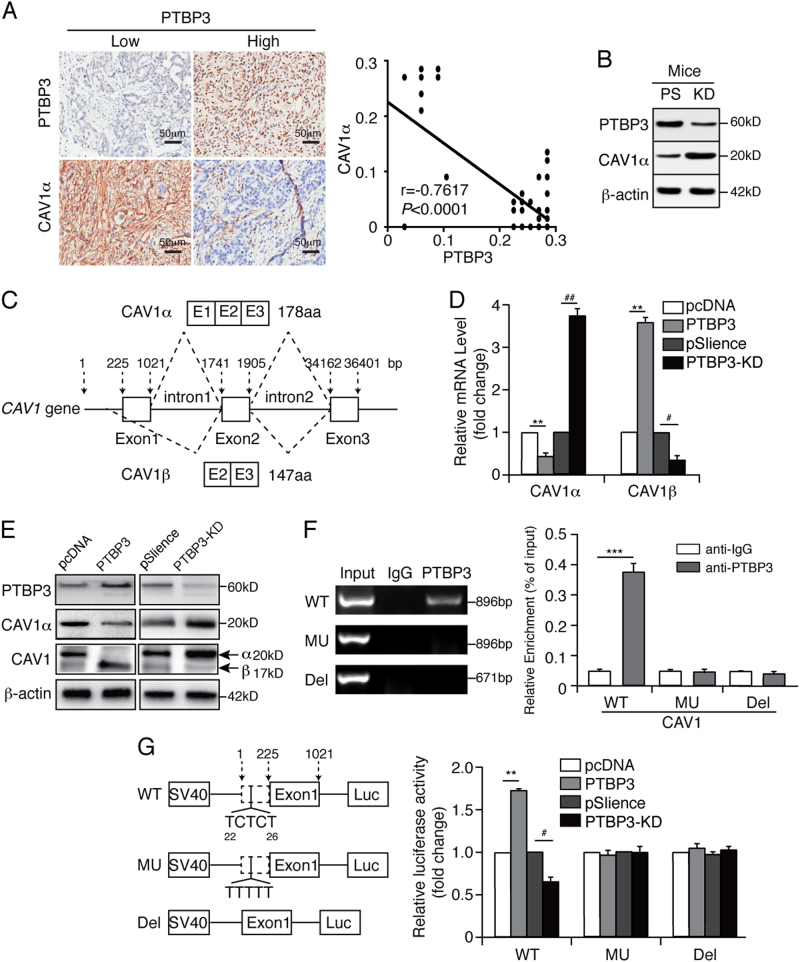
Fig. 5. PTBP3 modulates CAV1 alternative splicing via binding to its intronic region.
a Co-expression correlation analysis of two pairs of proteins in a clinical cohort of gastric cancer tissue samples (n = 69) by IHC. Images show individual protein staining in gastric cancer tissues from lymph node metastatic patients. Scale bars, 50 μm. Average cell-based staining intensity counts for each individual protein expressed in tumour cells were analysed using inForm software to assess co-expression correlations. b Western blot analysis of PTBP3 and CAV1α expressed in mouse tumours from PTBP3 knockdown and pSilence vector-transfected mice. c Schematic diagram of CAV1 alternative splicing. Real-time PCR (d) and western blot (e) analysis of the expression of PTBP3, CAV1α, and CAV1β in MKN45 cells with PTBP3 overexpression or knockdown (**P < 0.01 compared with pcDNA, ##P < 0.01 and #P < 0.05 compared with pSilence). f RIP experiments were performed using the PTBP3 antibody to immunoprecipitate in total cell extracts of MKN45-WT, MKN45-MU, MKN45-Del cells, and relative enrichment was determined by reverse transcription-PCR (left panel) and quantitative real-time PCR (right panel) (***P < 0.001). g CAV1 WT, MU, or Del intron was inserted downstream of the SV40 promoter, and reporter activity was analysed in MKN45 cells with PTBP3 overexpression or knockdown (**P < 0.01 compared with pcDNA, #P < 0.05 compared with pSilence). Each bar represents the mean ± SD of three independent experiments

