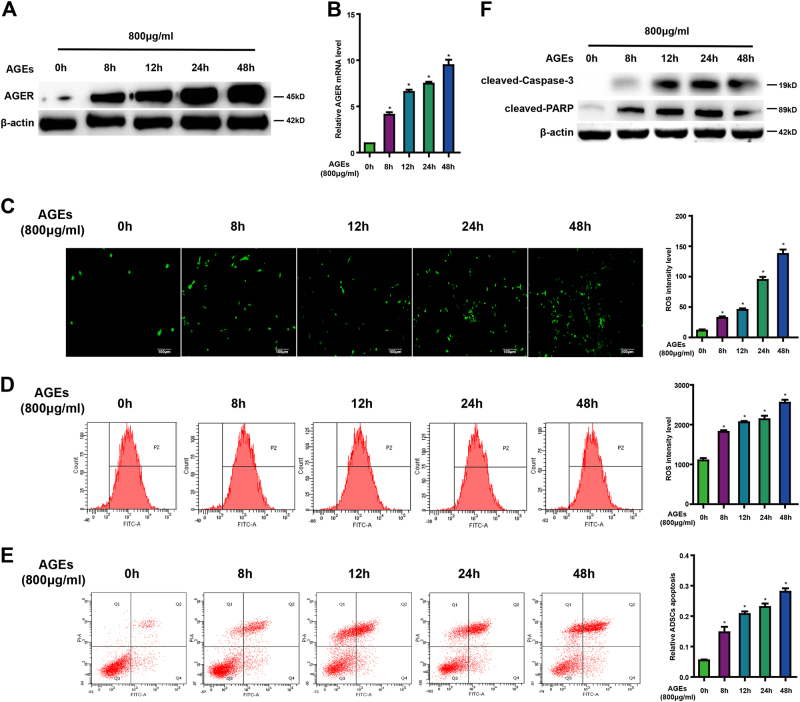
Fig. 1. Different concentration of AGEs on expression of AGER, ROS generation, and apoptosis in ADSCs.
a Representative western blot images showing the protein expression levels of AGER when ADSCs treated with different concentration of AGEs. b qPCR analysis of mRNA levels of AGER after cells treated with different concentration of AGEs. c Intracellular ROS production was observed under the fluorescence microscope. d The level of DCF-sensitive ROS was examined by a flow cytometer. e ADSCs were stained with annexin V-FITC/PI and immediately analyzed by flow cytometry. f Western blot analysis of protein levels of caspase-3 and PARP. Every experiment repeated at least three times. Error bars indicate mean ± SD (*P < 0.05)

