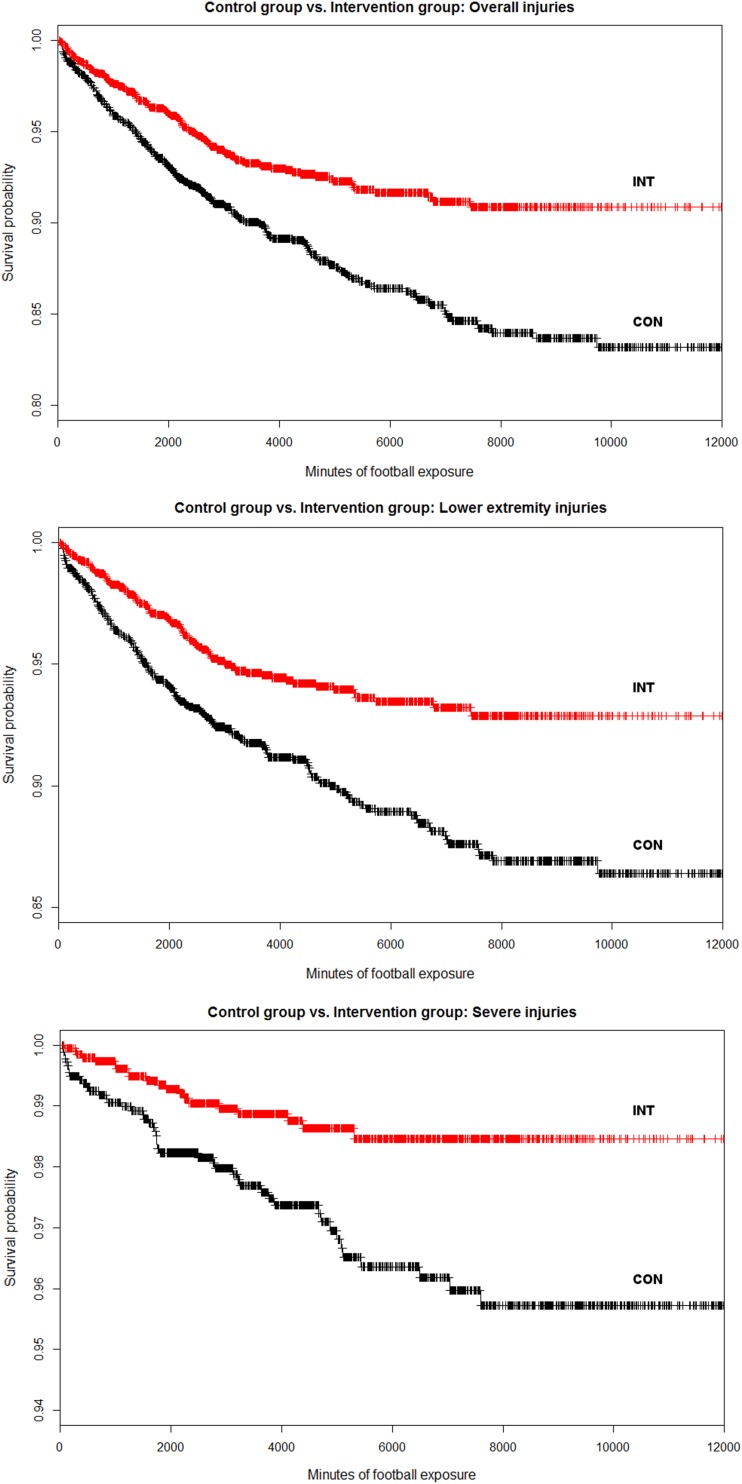
Fig. 2.
Kaplan–Meier plots of the control group (CON; performing their regular warm-up) and the intervention group (INT; performing ‘11+ Kids’ as a warm-up). The plot on the top shows the ‘survival probability’ regarding overall injuries, the middle plot shows the lower extremity injuries and the lower plot shows the severe injuries (resulting in > 28 days of lay-off time)

