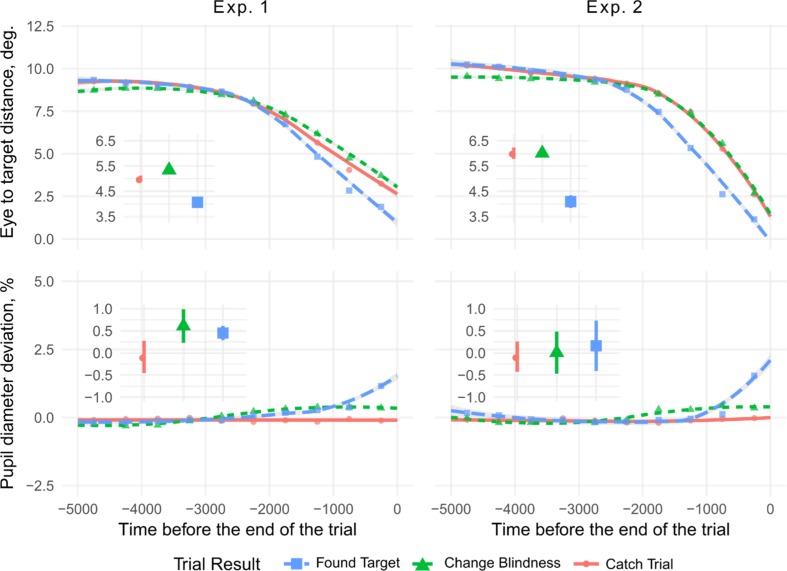
Fig. 7.
Pupil diameter and distances to gaze positions as a function of time before trial end. In the line plots, dots show mean values, lines show nonlinear smoothed trends. Subplots show mean values within the last 2,000 ms, with 95% within-subject confidence intervals as lines. Panels show that the distance between the target and gaze positions decreased toward the end of trials. Differences between trials are readily observed starting approximately 2 seconds before the end of the trial, and therefore we used this period as a limit for our further analyses. (Color figure online)

