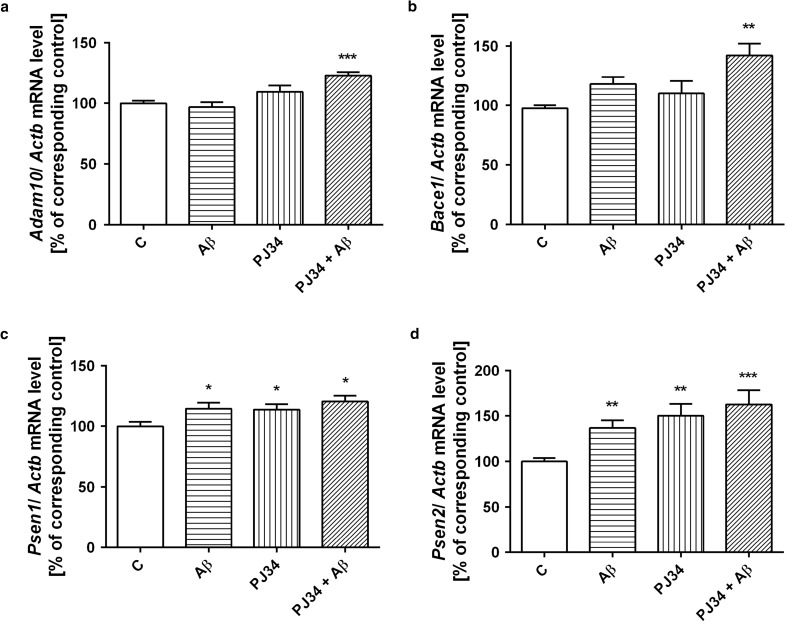
Fig. 4.
Expression levels of Adam10, Bace1, Psen1, and Psen2 genes in PC12 cells subjected to AβO42 (1 μM) and PJ-34 (20 μM) treatments (a–d). The levels of mRNA of secretases—Adam10 (a), Bace1 (b), Psen1 (c), and Psen2 (d)—were analyzed via quantitative RT-PCR. The results of RT-PCR were normalized to Actb gene expression. Data represent the mean value ± SEM for three independent experiments with three replications. ***p < 0.001; **p < 0.01, *p < 0.05—the difference, that was statistically significant compared to the control cells, using one-way analysis of variance (ANOVA) with Neuman-Keuls post hoc test

