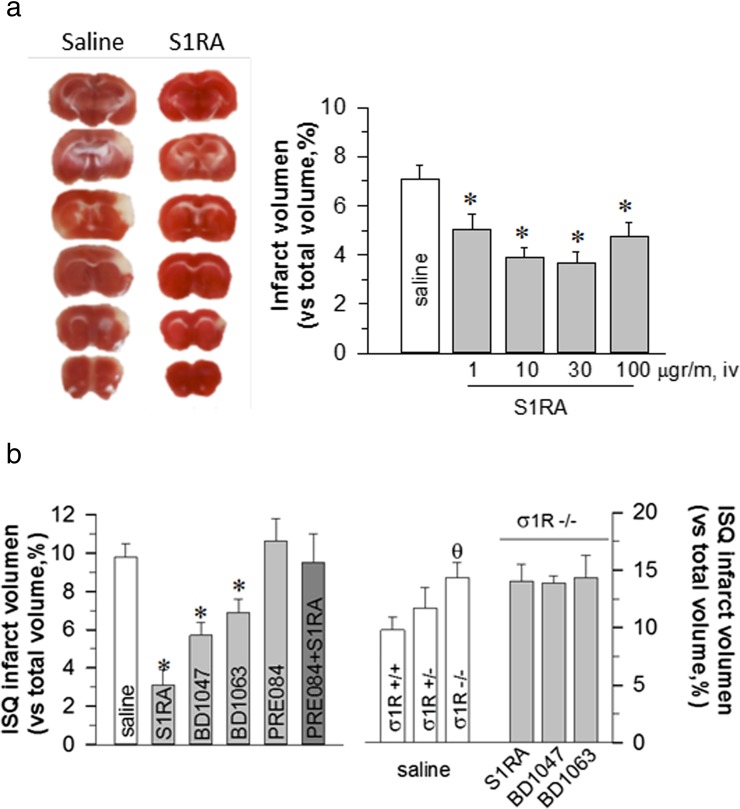
Fig. 2.
A Left: TTC stained brain section images were obtained from saline and S1RA treated mice (30 mg/mouse, iv; 1 h after surgery) 48 h after pMCAO. White indicates infarction; red staining indicates normal tissue. Right: Quantification of infarct volumes based on TTC staining. B Compounds were injected at a dose of 3 nmol/mouse 1 h after surgery. The bars quantitatively compare the infarct volume in WT mice. σ 1R−/− animals showed significantly greater infarct areas that were not reduced by S1RA administration. Groups consisted of 8–10 mice, and the data are represented as the means ± SEMs. Asterisk indicates the significant difference from saline-treated mice, θ significantly different from WT mice; degrees of freedom (df) = 16, all pairwise Holm-Sidak multiple comparison tests following ANOVA, p < 0.05

