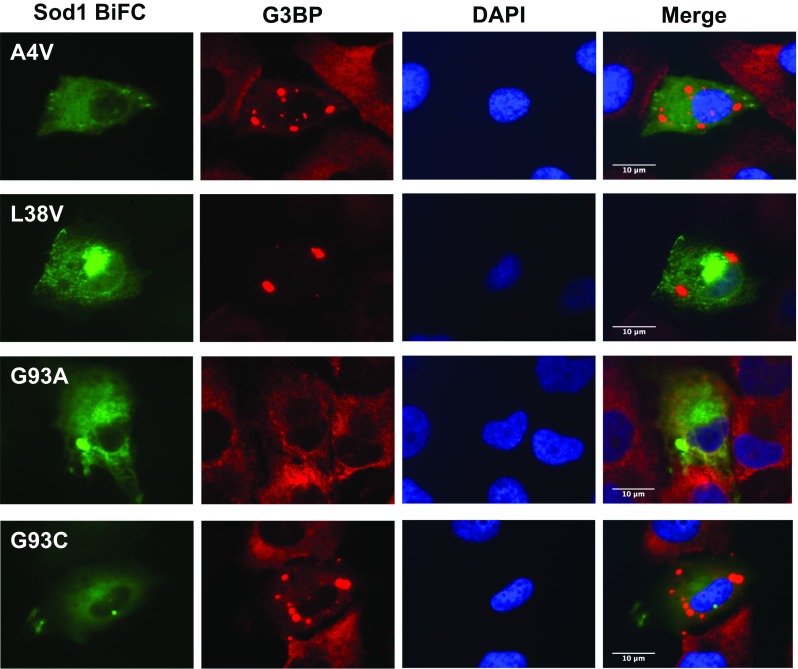
Fig. 2.

fALS mutant Sod1 inclusions do not colocalize with SGs. Inclusions of Sod1 were visualized by expression of BiFC-tagged Sod1 (green), and SGs were labeled by immunostaining with an antibody against G3BP (red). Nuclei were visualized with DAPI staining. Scale bar 10 μm. Magnification ×1000
