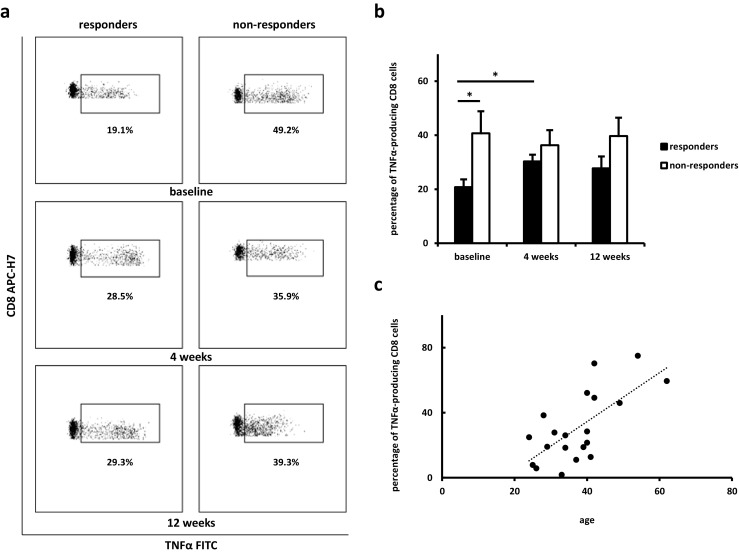
Fig. 1.

Differences in the intracellular TNFα staining of CD8 cells. Cytometric examples (a) and changes in the percentages of cells (b) in responding and non-responding groups at baseline, after 4, and 12 weeks from introducing anti-TNFα treatment. Data are shown as mean ± SEM; *P < 0.05. c Correlation between baseline percentage of TNFα-producing CD8 cells and patients’ age (r = 0.7; P = 0.0009)
