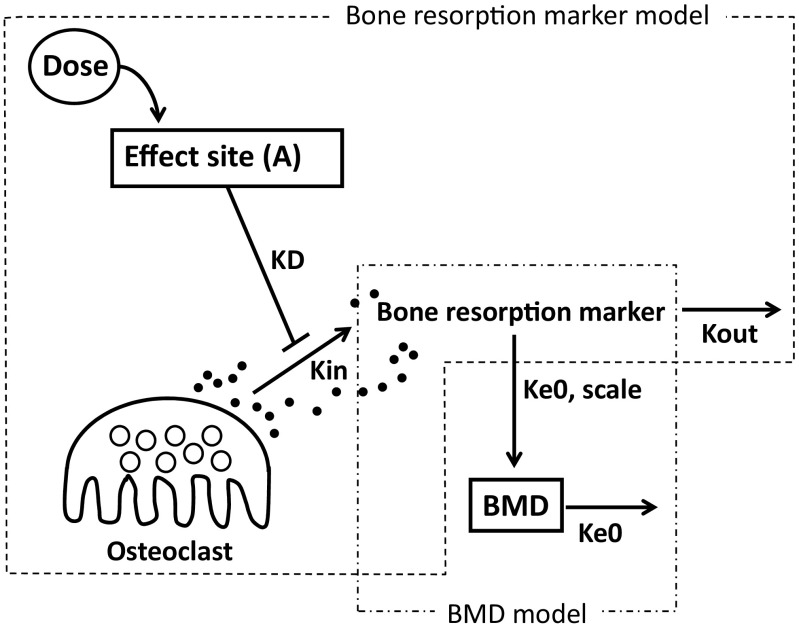
Fig. 1.
Schematic description of the mathematical model of ZOL to describe the time-dependent profiles of bone resorption markers and BMD. Effect site hypothetical site where ZOL is stored until the onset of the inhibitory effect, KD first-order equilibrium rate constant, Kin bone resorption marker production rate constant, Kout bone resorption marker elimination rate constant, Ke0 effect-compartment equilibrium rate constant, Scale ratio of change in bone resorption marker values to change in BMD, BMD bone mineral density

