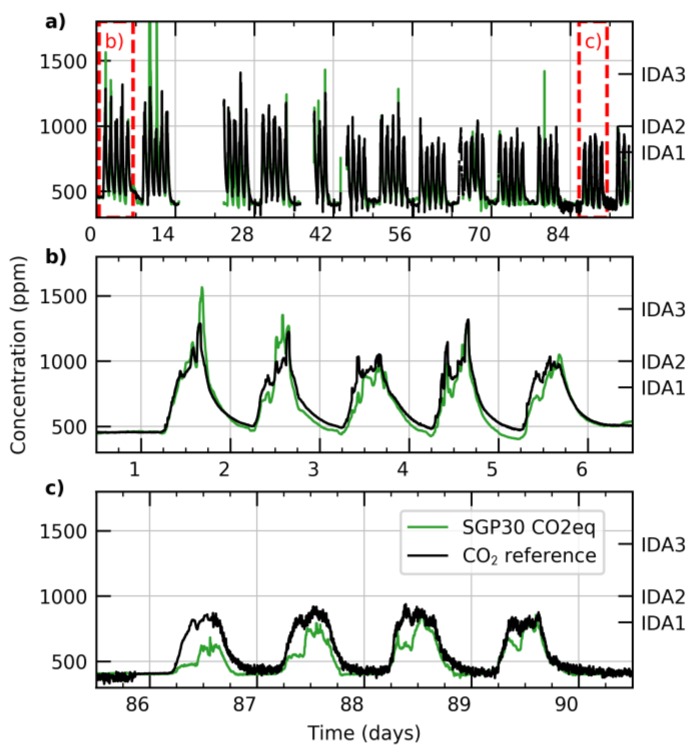
Figure 9.
CO2 data taken over about 3 months in a typical corporate meeting room (a). The output of the non-dispersive infrared (NDIR) CO2 reference (black line) is compared to the output of the SGP CO2eq algorithm (green line). The two red rectangles indicate the position of the zoom-ins provided in panels (b,c). On the secondary y-axis the maximum values of the corresponding indoor air-quality (IDA) levels are indicated [53].

