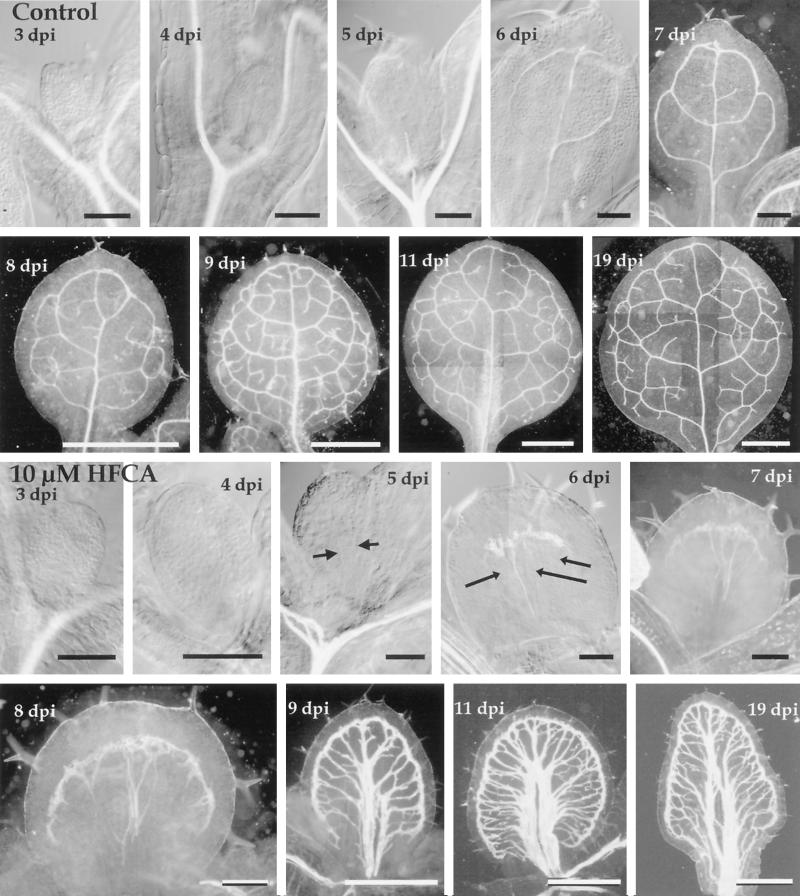
Figure 6.
Development of leaf vein pattern in control and polar auxin transport-inhibited plants. The top two rows show the vein pattern of the first leaf from a developmental time course of control plants. The bottom two rows show the same time points for the first leaf of seedlings grown in the presence of 10 μm HFCA, a polar auxin transport inhibitor. Arrows in the 5- and 6-DPI HFCA-treated leaf primordium indicate files of provascular tissue. Time is indicated as DPI, days post imbibition. Size bars for 3- to 6-DPI leaves (control and HFCA-treated) = 100 μm; for 7-DPI leaves (control and HFCA-treated) and 8-DPI HFCA-treated = 200 μm; for 8- to 19-DPI control and 9- to 19-DPI HFCA-treated = 1 mm.

