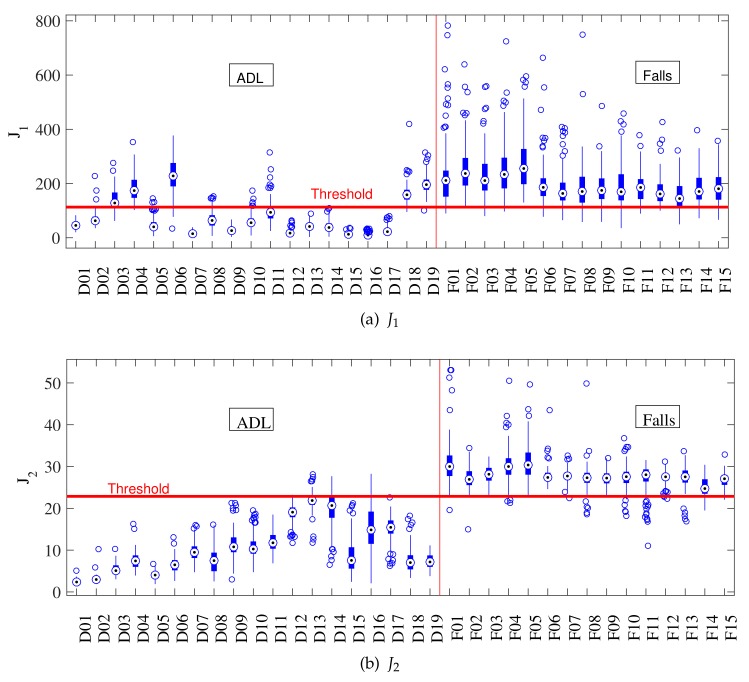
Figure 4.
Individual activity analysis of sum vector magnitude and standard deviation magnitude . The horizontal red line corresponds to the optimal threshold value, and the vertical one separates ADLs and falls. (a) has large errors on periodic activities (D1–D6, D18–D19); while (b) fails in those that change the body angle (D13, D14).

