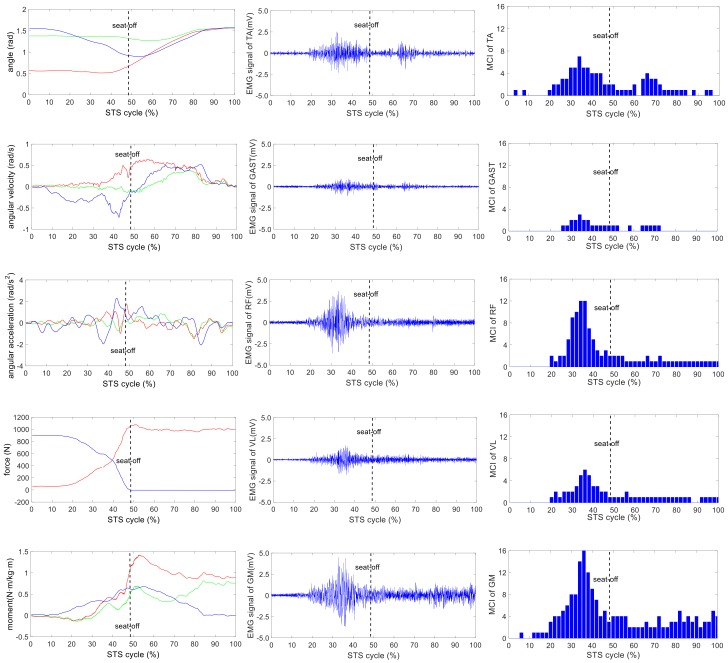
Figure 8.
The analysis result of a typical STS task with 20-kg loadings: the left column shows the hip, knee and ankle joint angles and moments (green, red and blue lines, correspondingly), angular velocities and angular accelerations of the HAT, thigh and shank (green, red and blue lines, correspondingly) and VCRF and VGRF (blue and red lines, correspondingly). The middle column shows the surface EMG signals of the five lower limb muscles (TA, GAST, RF, VL and GM). The third column shows the muscle contribution indexes (MCI) of the five lower limb muscles (TA, GAST, RF, VL and GM).

