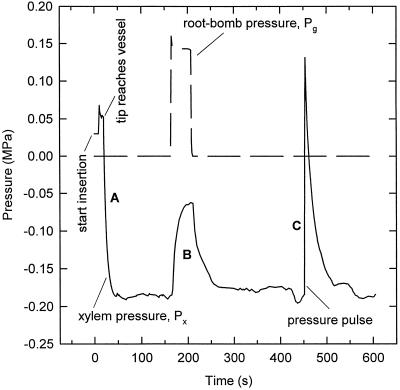
Figure 4.
Test for proper location and functioning of cell pressure probes in the leaf xylem of intact maize plants. In A, the insertion of the cell pressure probe is shown followed by an adjustment to a steady value of Px. In B, a pulse of pneumatic pressure was applied to the root which was rapidly reflected into a change of xylem pressure (half time: ≈8 s; see also Fig. 4). In C, a typical pressure relaxation is shown following a pressure pulse produced by the probe. Pressure relaxations exhibited short half-times as well (half time of approximately 10 s in the experiment given in the figure). Test B) indicates that the probe was able to rapidly detect changes in xylem pressure. Test C indicates that the tip of the probe was open and that its response time (half-time) for measuring changes was short. It should be noted that the half-time measured in C would represent an upper limit for the resolution in time of changes of Px that could be detected.

