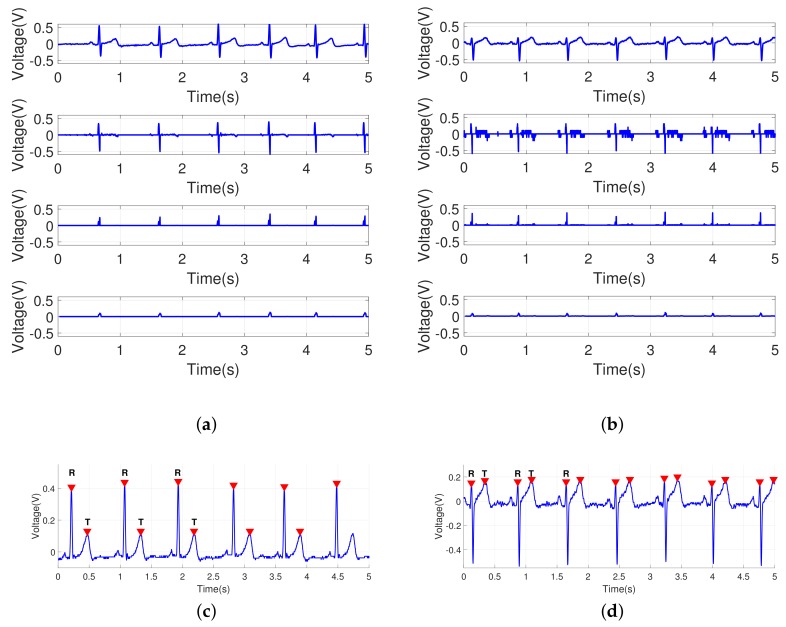
Figure 5.
Extracting the peak points for two different ECG signals: (a,b) results of the sequential process for extracting the peak points; signal after band-pass filtering, differentiated signal, squared signal, and signal passing through the moving average filter; (c) detected peak points (R and T points) for the ECG signal in Figure 4 (top); (d) detected peak points (R and T points) for the ECG signal in Figure 4 (bottom); another pass of scanning is needed to determine the T points after a pair of R points are found.

