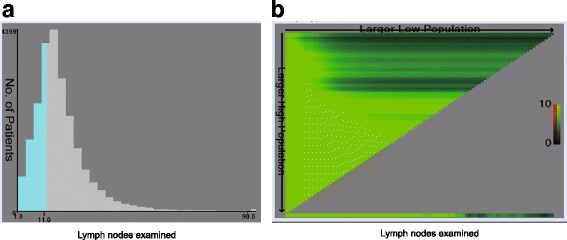
Fig. 1.

a The number of lymph nodes distribution according to lymph nodes examined. Ranged from 0 to 90. b X-tile plots for lymph nodes constructed by left-sided Patients with colon cancer. The plots dividing them into 2 groups by the cutoff point 10. The brightest pixel represents the maximum χ2 log-rank value
