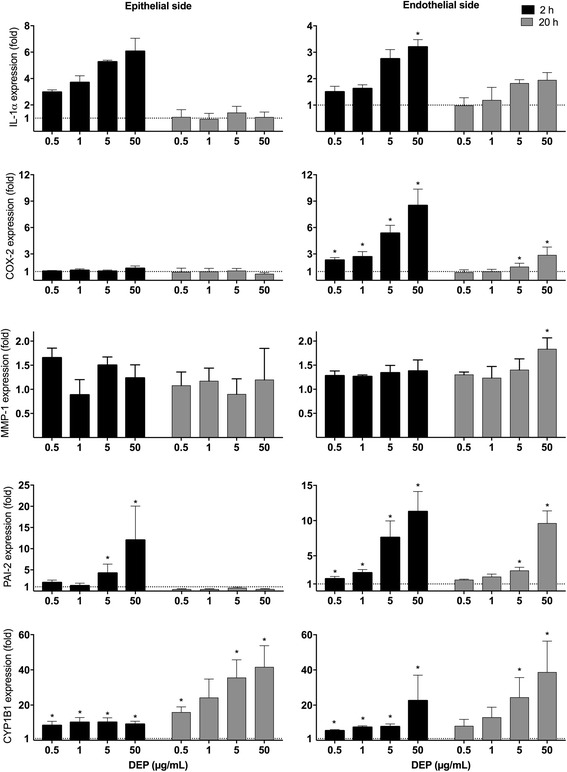
Fig. 1.

Effect of DEP exposure on gene expression in a 3D tri-culture model. Increasing concentrations of DEP were applied to the epithelial side of the 3D tri-culture. After 2 and 20 h of exposure, alveolar and endothelial cells were harvested and the expressions of IL-1α, COX-2, MMP-1, PAI-2 (SERPINB2) and CYP1B1 mRNAs were measured by q-PCR. The mRNA levels are presented relative to gene expression in cells exposed to DMSO, represented by the dotted line at 1. The results are expressed as mean ± SEM (n = 3). *Statistically significant difference from unexposed controls
