
Fig. 1.
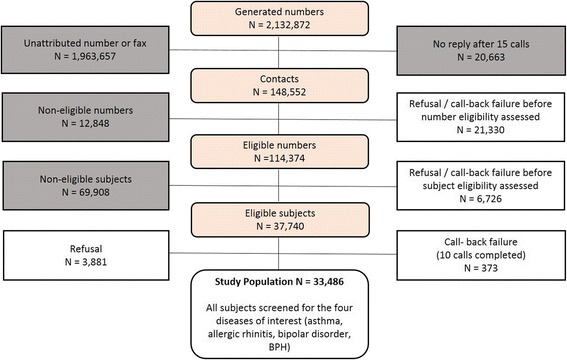
Subject flow through the recruitment process. The grey boxes indicate excluded numbers or subjects, and the white boxes the groups of potentially eligible numbers or subjects taken into account in the calculation of the response rate
Official websites use .gov
A
.gov website belongs to an official
government organization in the United States.
Secure .gov websites use HTTPS
A lock (
) or https:// means you've safely
connected to the .gov website. Share sensitive
information only on official, secure websites.
Subject flow through the recruitment process. The grey boxes indicate excluded numbers or subjects, and the white boxes the groups of potentially eligible numbers or subjects taken into account in the calculation of the response rate