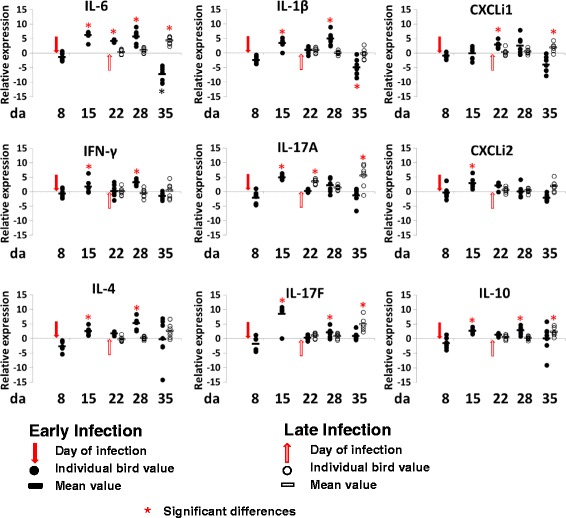
Fig. 3.

Relative change in expression of cytokines and chemokines in ileum tissues. Relative gene expression represents log2 ratio infected/non-infected from qPCR of infected birds (TLG2 and TEG2) compared to expression in tissues from non-infected birds (TLG1 and TEG1). Significant differences between 2-ΔCt values of the control and Campylobacter-colonized groups are indicated by an asterisk (ANOVA p < 0.05, *) for the expression of each gene at the corresponding time points
