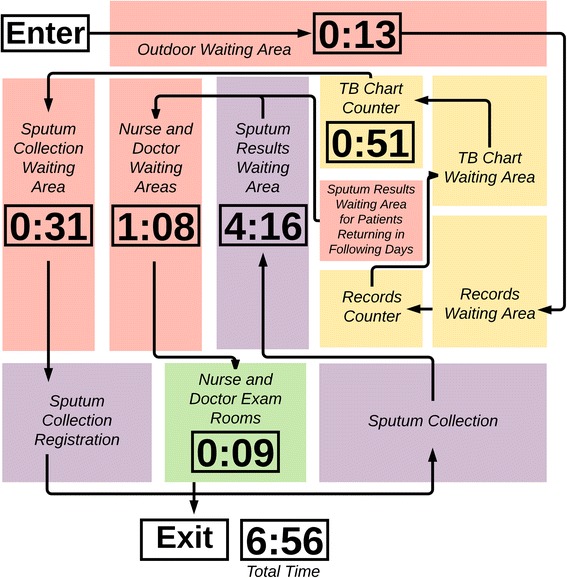
Fig. 4.

TB patient flow map. Times are reported in hours and minutes (hours:minutes). Yellow boxes are all included in the 0:51 waiting time, purple boxes are all included in the 4:16 waiting time, the green box is exam rooms, and red boxes are other areas involved in TB patient care. Map is not to scale
