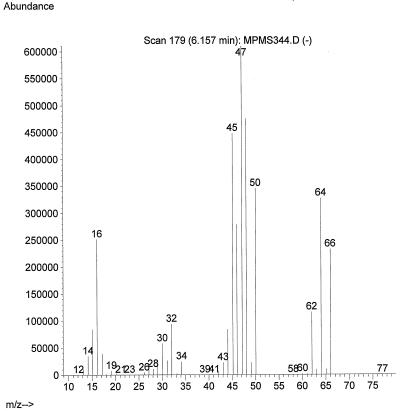
Figure 1.
Mass spectrum of [13C2,18O2]acetic acid, prepared at 99% 13C and 58% 18O enrichments. The major molecular ion peaks are at m/z = 62, corresponding to 13C2H416O2; m/z = 64, corresponding to 13C2H416O18O; and m/z = 66, corresponding to 13C2H418O2. Minor molecular ion peaks are seen at m/z = 63, corresponding to 12C 13CH416O18O; and m/z = 65, corresponding to 12C 13CH418O2.

