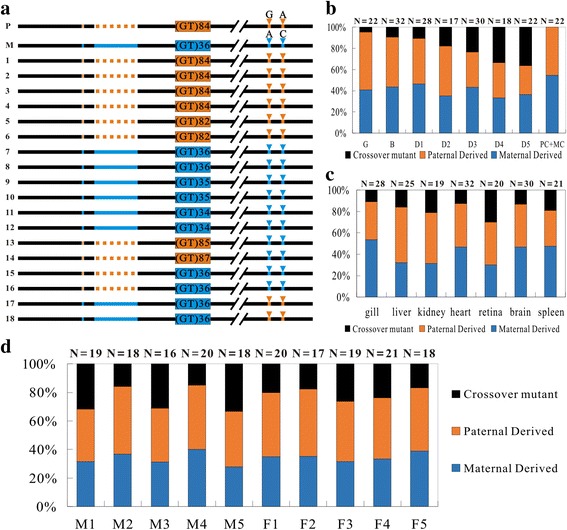
Fig. 2.

Mitotic homologous recombination at the (GT)n motif1 region. a The linkage patterns of the paternal and maternal genetic makers flanking (GT)n motif1 in 4-day old heterozygous embryos. Black lines represent the conserved regions. Orange lines, dotted lines and arrow heads represent the paternal genetic markers. Blue lines, dotted lines and arrow heads represent the maternal genetic markers. Orange and blue boxes represent the paternal and maternal (GT)n motif 1, respectively. Gray boxes represent the contracted or expanded (GT)n motif 1. b Proportion of different clones in heterozygous embryos at different developmental stages. c Proportion of different clones in different tissues of an adult heterozygous individual. d Proportion of different clones in different adult heterozygous individuals. Numbers of sequenced clones are indicated at the top. M1-M5, the number of male samples. F1-F5, the number of female samples. PC + MC, mixed sample with 4-day embryos of homozygous paternal and maternal control in equal amounts
