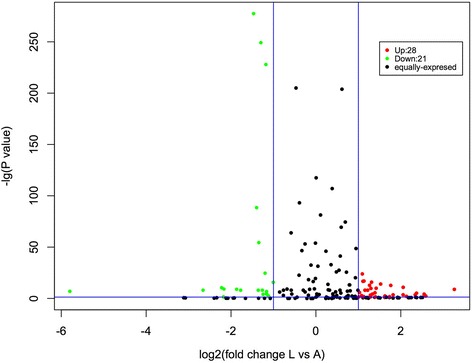
Fig. 3.

Analysis of differential miRNA expression between lambs and adults. Each point in the figure represents a microRNA. The X axis shows log2 normalized read counts and the Y-axis shows -log10(p-value). The vertical lines show thresholds for log2 ratio larger than 1 or lower than − 1. The horizontal line shows threshold for p-value< 0.05. The black points represent miRNAs exhibiting no significant differential expression between lambs and adults; the red points represent miRNAs that are more abundant in lambs than adults; the green points represent miRNAs that are less abundant in lambs than adults
