
Fig. 5.
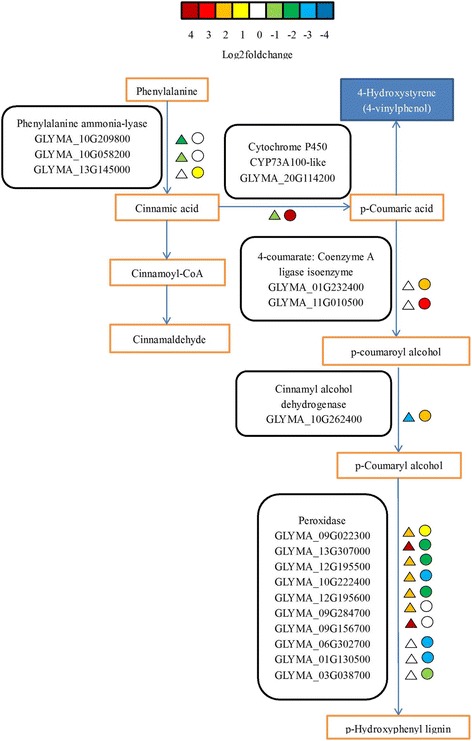
Modulation of phenylpropanoid biosynthesis pathway under Sneb545-treated and non-treated soybean roots infected with SCN compared with not infected with SCN. Log2foldchange levels of different gene expression are presented at left triangle box (non-treated soybean roots infected with SCN compared with non-treated soybean roots not infected with SCN, CI vs CN), and at right square box (Sneb545-treated soybean roots infected with SCN compared with Sneb545-treated soybean roots not infected with SCN, TI vs TN). Green and red boxes indicate down- or up-regulation of the genes