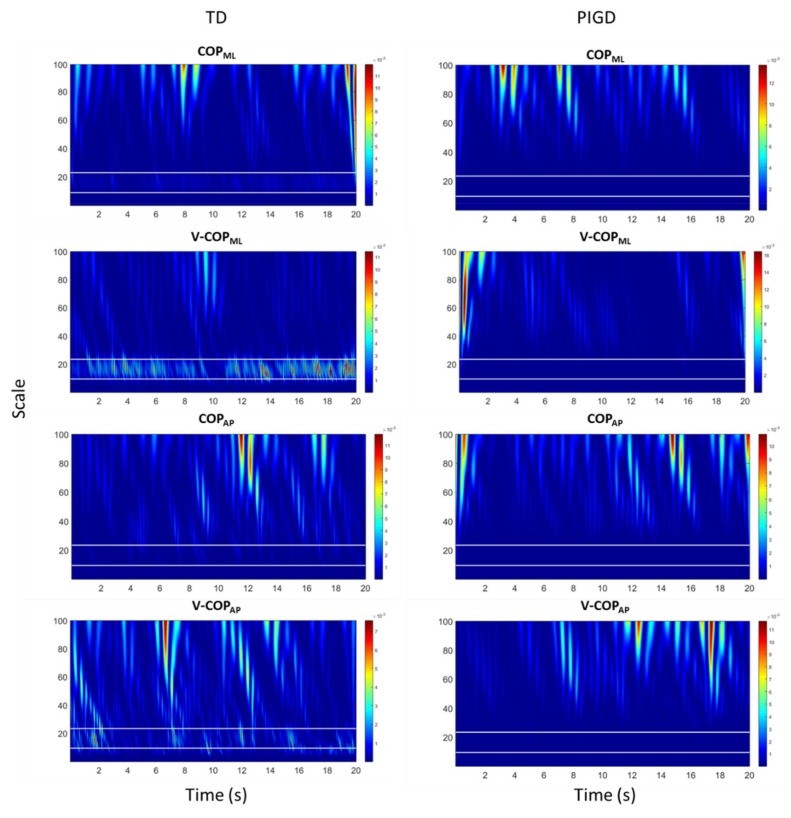
Figure 2.
Wavelet transform (WT) of COP and COP velocity of a TD patient and a PIGD patient for both the ML and AP directions. The horizontal white lines in each plot indicate the PD tremor scale range corresponding to the frequency range of 3–7 Hz. The frequencies of 3 Hz and 7 Hz correspond to the scales of 24 and 10, respectively. COPML: COP in the ML direction, COPAP: COP in the AP direction, V-COPML: COP velocity in the ML direction, and V-COPAP: COP velocity in the AP direction.

