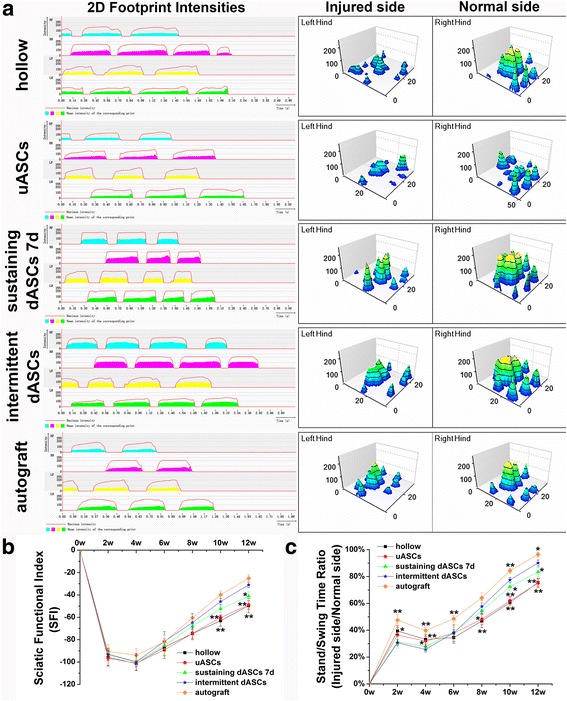
Fig. 5.

Gait analysis and sciatic functional recovery after cell transplantation. a Representative two-dimensional (2D) and three-dimensional (3D) stress diagrams of each group at 12 weeks after cell transplantation. b The obvious advantage began to appear in the SFI in the intermittent dASCs group at week 10 following cell transplantation. The improvement of the SFI in the intermittent dASCs group (−31.07 ± 2.24) was significantly superior (p < 0.05) to those in the hollow (−49.58 ± 6.35), uASCs (−48.88 ± 3.93), and sustaining dASCs 7d groups (−41.14 ± 4.03) in the twelfth week after cell transplantation, and showed no significant difference compared with the autograft group (−25.09 ± 3.13). c In the first 4 weeks, the stand/swing time ratio in intermittent dASCs was always significantly lower (p < 0.05) than those in the hollow, uASCs, and autograft groups. The advantages of the intermittent dASCs group began to appear at week 8 after cell transplantation. Until the last time point, the stand/swing time ratio in the intermittent dASCs (90.10 ± 2.25%) was significantly better (p < 0.05) than those in the hollow (75.51 ± 2.80%), uASCs (75.13 ± 3.47%), and sustaining dASCs 7d groups (83.39 ± 3.68%). Data are expressed as means ± SEM. *p < 0.05, **p < 0.01, one-way ANOVA with Tukey’s post-test or Dunnett’s T3 post-test. dASC, differentiated adipose-derived stem cell; uASC, undifferentiated adipose-derived stem cell
