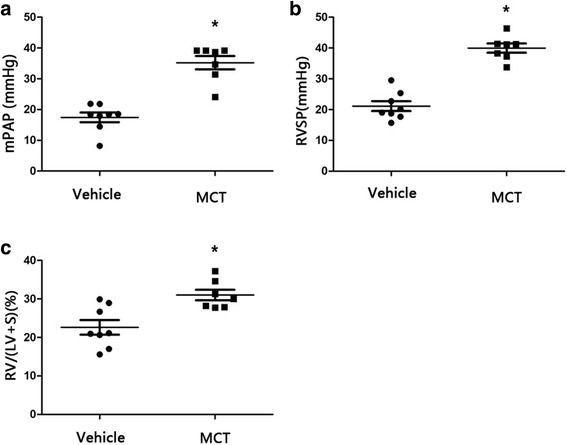
Fig. 1.

Successful establishment of PAH model in MCT-treated group. The mPAP (a), RVSP (b), RV/(LV + S) (c) were significantly higher in the MCT group than that in vehicles (MCT, n = 7; Vehicle, n = 8). MCT = monocrotaline; mPAP = mean pulmonary artery pressure; RVSP = right ventricular systematic presure; RV/(LV + S) = right ventricular/(left ventricular + septum) (*P < 0.05)
