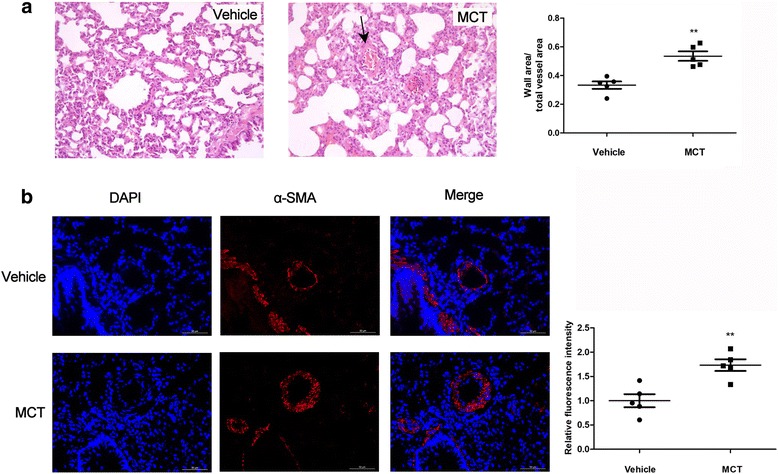
Fig. 2.

Increased pulmonary vascular remodeling in MCT induced rats. (a) Representative micrographs of histological assessment demonstrating thickening of the pulmonary vascular (black arrow) in the PAH model group; (b) Representative micrographs of Immunostaining of lung-tissue-treated rats revealing increasing α-SMA expression in the distal pulmonary arteries (MCT, n = 5; Vehicle, n = 5). α-SMA = α-smooth muscle actin; MCT = monocrotaline (**P < 0.01)
