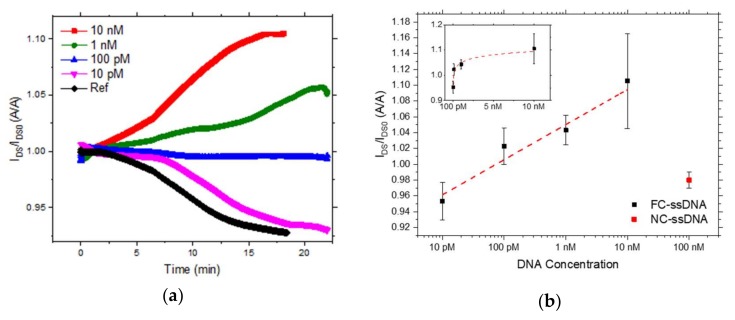
Figure 3.
(a) Output current of a sensor after the addition of 10 nM (red curve), 1 nM (green curve), 100 pM (blue curve), 10 pM (purple curve) of FC-ssDNA and of the sole TRIS buffer solution without the FC-ssDNA (black curve). (b) Output current variation of the sensor, normalized with respect to their baseline current, as a function of target ssDNA concentration (FC-ssDNA, black square and NC-ssDNA, red square). The inset reports the output current variation as a function of the FC-ssDNA in a linear scale.

