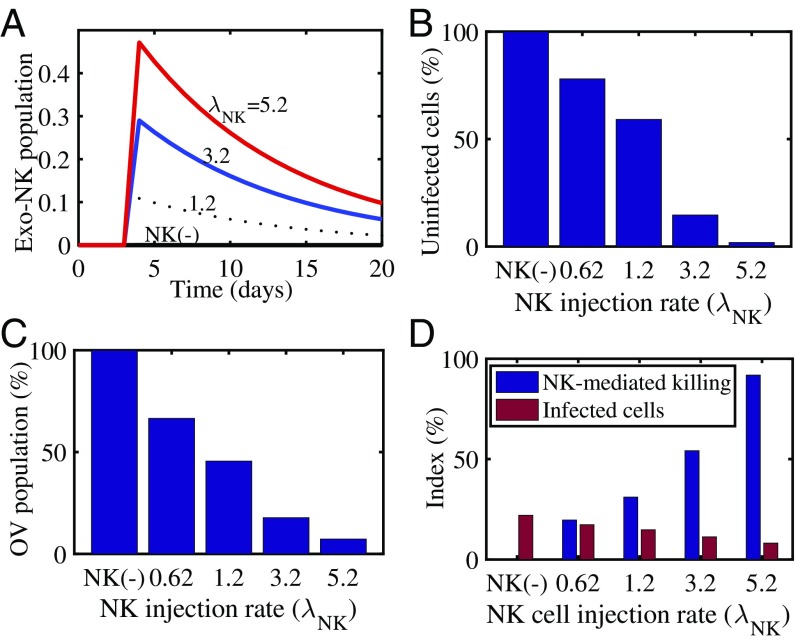
Fig. 2.
Simulation results for NK cell-mediated antitumor cell killing and infected cells with various NK injection rates (). (A) Time courses of exogenous NK (exo-NK) cell populations for (NK), 1.2, 3.2, and 5.2. (). (B) Normalized population (percent) of uninfected cancer cells for , 0.62, 1.2, 3.2, and 5.2. (C) Normalized OV population (percent) for , 0.62, 1.2, 3.2, and 5.2. (D) NK cell-mediated antitumor killing (blue) and infected cell populations (red) at final time ( d) for various injection rates [ (NK), 0.62, 1.2, 3.2, and 5.2].

