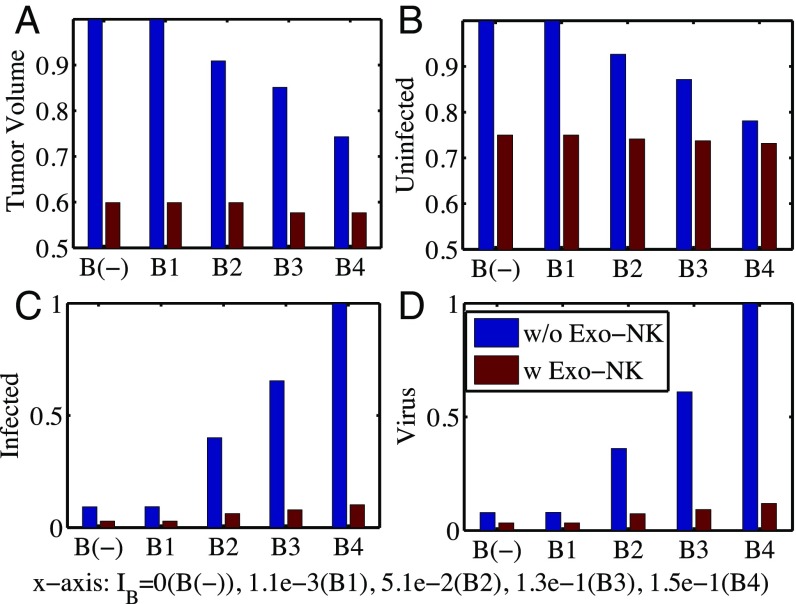
Fig. 4.
Effect of bortezomib on antitumor efficacy. (A) Normalized tumor volume at day 40 without (blue bars) and with (red bars) exogenous NK cell injection for various bortezomib supply rates (). (B–D) Relative population of uninfected cancer cells (B), infected cancer cells (C), and oHSV (D), corresponding to A.

