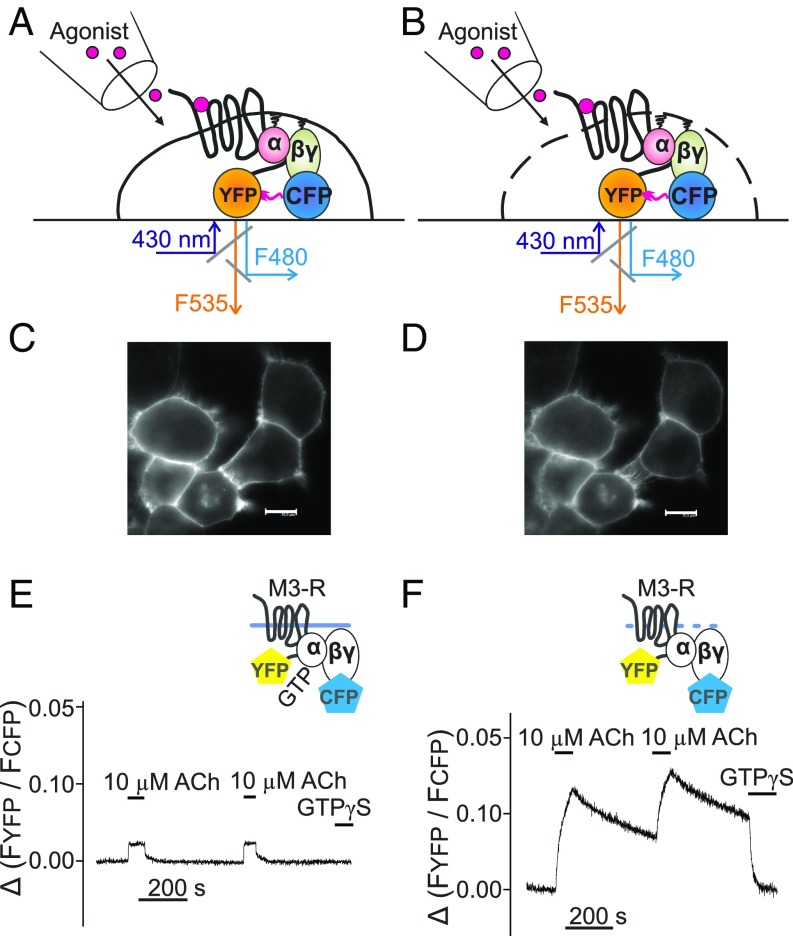
Fig. 1.
Assay to measure G-protein–receptor interaction. Gq-protein binding to the M3–R was measured either in intact (A, C, and E) or permeabilized (B, D, and F) cells by means of brief exposure to saponin as schematically illustrated in B. HEK293T cells transfected with M3–R C-terminally labeled with YFP, Gαq-WT, Gβ1-WT, and Gγ2 N-terminally labeled with CFP (C–F) were subjected to confocal microscopy and imaged for the CFP fluorescence before (C) and after membrane permeabilization (D). (Scale bars, 10 μm.) For FRET measurements, cells were excited at 430 nm, and YFP and CFP emission was simultaneously imaged using a dual-emission fluorescence microscope. The YFP/CFP emission ratio derived from a single cell was calculated and plotted over time (E and F), and the superfusion of cells with agonists or GTPγS occurred as indicated.

