Fig. 3.
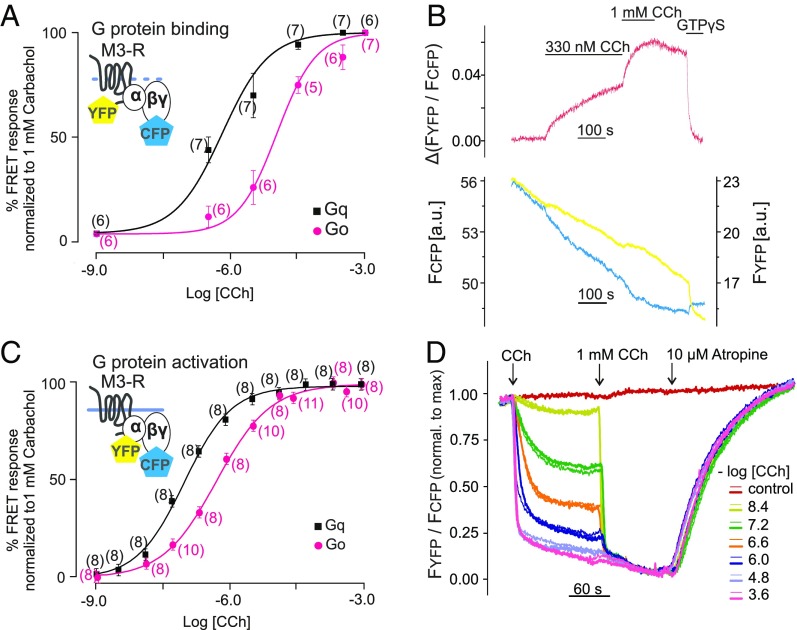
Comparison of receptor–G-protein binding and activation of G proteins. (A) Concentration–response curves of Gq (black) and Go (pink) binding to M3–R under GTP-free conditions. FRET imaging in single permeabilized cells was performed as described in Fig. 1F. Increasing concentrations of CCh were applied as shown in a representative trace of a Gq-expressing cell (B). The change of YFP/CFP emission ratio was normalized to the amplitude observed on application of saturating CCh concentration (1 mM; maximum response) and the YFP/CFP ratio measured under the application of GTPγS (minimum response). To achieve steady-state conditions at low CCh concentrations (under 100 nM), cells were incubated for 10 min. (C and D) Concentration–response curves of Gq and Go activation by M3–R were determined in intact cells using established G-protein FRET assays (61). (D) Representative traces of FRET between YFP-labeled Gα subunit and CFP-labeled Gγ2 subunit were measured in duplicates (overflow technique) simultaneously in 12 individual wells derived from a 96-well plate and normalized to the maximal response (1 mM CCh). All concentration–response data are represented as means ± SEM for each condition; n of each experiment is shown in parentheses. Statistical analysis was performed by one-way ANOVA with Bonferroni post hoc test (P < 0.05).

