Fig. 6.
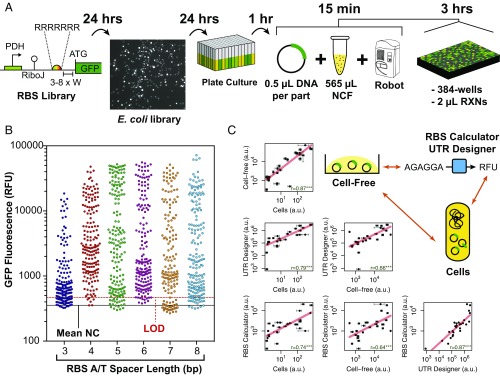
Rapid quantification of RBS library parts in B. megaterium NCF. (A) A semiautomated workflow and time-scale from library generation to cell-free screening of RBS activities. [The image in the second place in A was taken with a Gel Doc XR (Bio-Rad Laboratories, Hercules, CA) at ∼10× magnification.] (B) Distribution of library groups (RBS-3, -4, -5, -6, -7, and -8) rapidly screened in 2-μL reactions in 384-well plates. Solid black line represents mean negative control (NC) signal and dotted red line represents limit of detection (3σ from mean NC signal). Four measurement repeats per RBS variant (44 per group) were randomly distributed within the plate by the Echo PickList software. (C) Correlation of cell-free, in vivo, and in silico prediction (54, 55) activities of 26 RBS-6 variants with correlation coefficients and statistical significance shown within each individual plot. For full data, please see SI Appendix, Figs. S38 and S39 and Tables S12 and S13.

