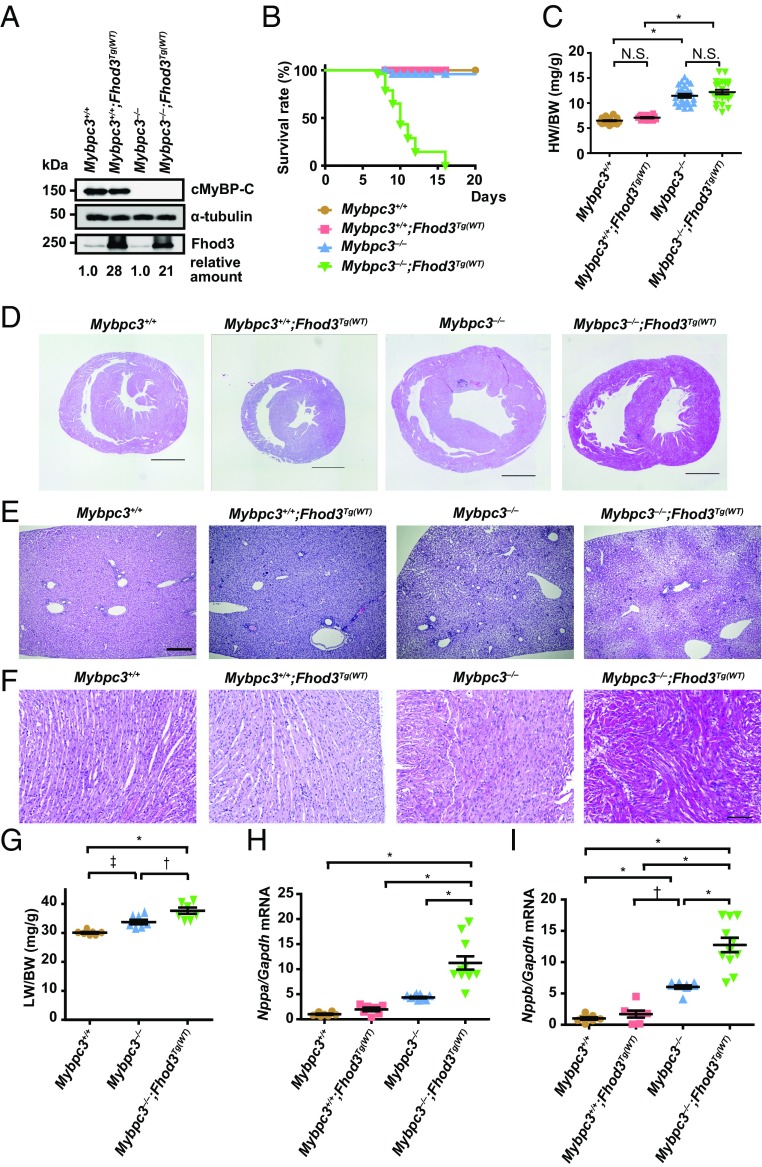
Fig. 5.
Physiological effects of transgenic overexpression of Fhod3 in cMyBP-C–null mice. (A) Immunoblot analysis of Fhod3, cMyBP-C, and α-tubulin using whole heart tissue lysates from wild-type (Mybpc3+/+), Fhod3-Tg [Mybpc3+/+;Fhod3Tg(WT)], cMyBP-C–null (Mybpc3−/−), and cMyBP-C–null mice overexpressing Fhod3 [Mybpc3−/−;Fhod3Tg(WT)] at P9. (B) Survival curves of mice of the indicated genotypes [Mybpc3+/+, n = 52; Mybpc3+/+;Fhod3Tg(WT), n = 38; Mybpc3−/−, n = 50; Mybpc3−/−;Fhod3Tg(WT), n = 52]. (C) Heart-to-body weight ratio of cMyBP-C–null mice overexpressing Fhod3 [Mybpc3−/−;Fhod3Tg(WT), n = 23] and control mice [Mybpc3+/+, n = 30; Mybpc3+/+;Fhod3Tg(WT), n = 14; Mybpc3−/−, n = 24] at P9. Values are means (long bars) ± SEM (short bars). *P < 0.001; N.S., not significant. (D–F) Histological analysis of hearts and livers of cMyBP-C–null mice overexpressing Fhod3 [Mybpc3−/−;Fhod3Tg(WT)] and control mice at P9. Short-axial sections of hearts (D), liver tissues (E), and short-axial–sectioned lateral wall of the left ventricles (F) were stained with H&E. (Scale bars: 1 mm in D and E and 100 μm in F.) (G) Liver-to-body weight ratio of cMyBP-C–null mice overexpressing Fhod3 [Mybpc3−/−;Fhod3Tg(WT), n = 7] and control mice (Mybpc3+/+, n = 7; Mybpc3−/−, n = 7) at P9. Values are means (long bars) ± SEM (short bars). *P < 0.001, †P < 0.01, ‡P < 0.05. (H and I) Quantitative real-time PCR analysis of fetal cardiac gene expression in cMyBP-C–null mice overexpressing Fhod3 [Mybpc3−/−;Fhod3Tg(WT), n = 11] and control mice [Mybpc3+/+, n = 8; Mybpc3+/+;Fhod3Tg(WT), n = 7; Mybpc3−/−, n = 9] at P9. Values are means (long bars) ± SEM (short bars). Nppa, encoding ANF; Gapdh, encoding GAPDH; Nppb, encoding BNP. *P < 0.001, †P < 0.01.

