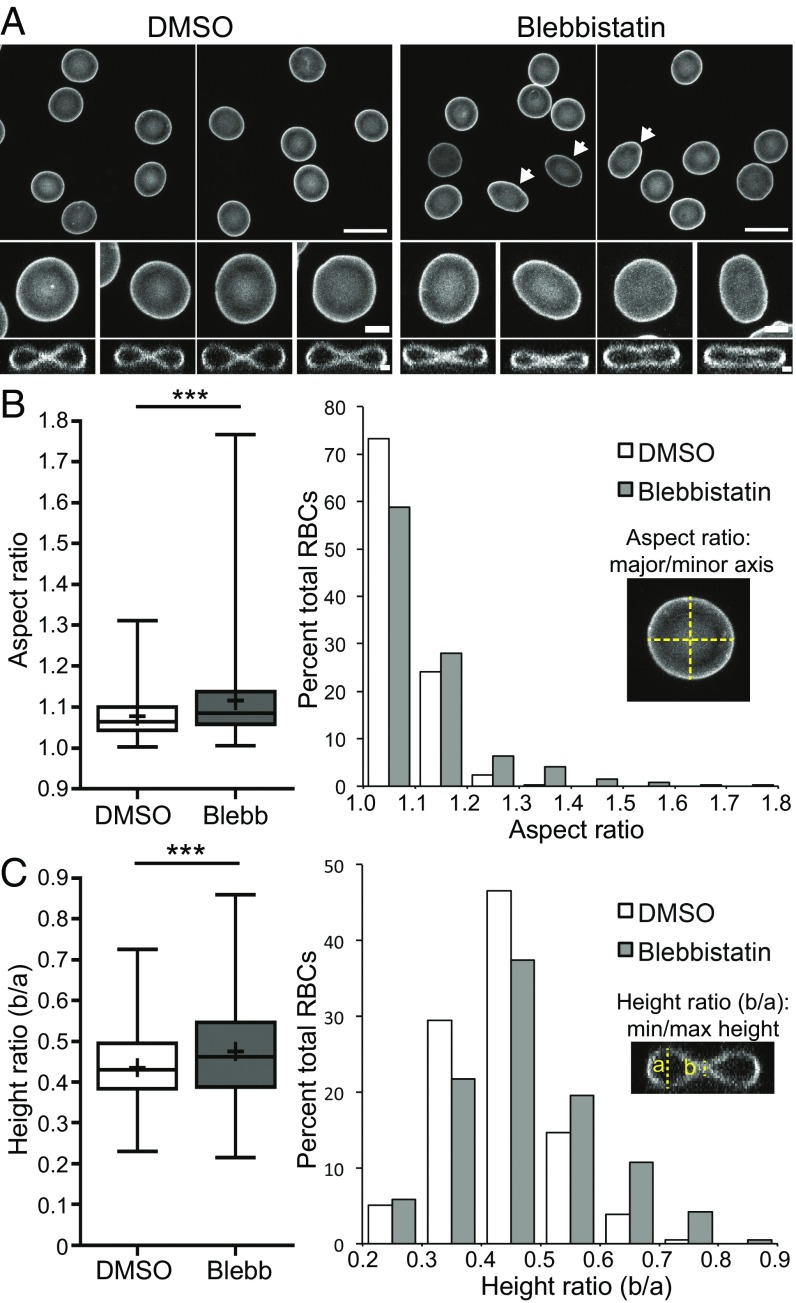
Fig. 4.
NMIIA motor activity controls RBC morphology. (A) Confocal fluorescence microscopy images of glycophorin A-stained RBCs after treatment with DMSO or 20 μM active blebbistatin. XY maximum intensity projections (Top and Middle) and XZ slices from the middle of the cell (Bottom) are shown. (Scale bars: Top, 10 μm; Middle, 2 μm; Bottom, 1 μm). DMSO-treated control RBCs are round in XY and biconcave in XZ views, as expected. Note elongated cells (arrows) and cells with relaxed dimples after treatment with blebbistatin. (B) RBC elongation measured from aspect ratios (major/minor axis) in XY maximum intensity projections as in A. A box-and-whisker plot (Left) and histogram (Right) are shown. DMSO versus blebbistatin (Blebb) (***P < 0.0001) is shown. Variances were significantly different by F-test (***P < 0.0001). (C) RBC biconcavity measured from the ratio of cell height at the dimple to the height at the rim from XZ slices as in A. A box-and-whisker plot (Left) and histogram (Right) are shown. DMSO versus Blebb (***P < 0.0001) is shown. Variances were significantly different by F-test (***P < 0.001). For box-and-whisker plots, the middle line represents the median; upper and lower lines represent the third and first quartiles, respectively; and whiskers represent minimum and maximum values. Plus symbols denote means. Cells are shown for the following: DMSO [n = 423 RBCs (four donors)] and blebbistatin [n = 410 RBCs (four donors)].

