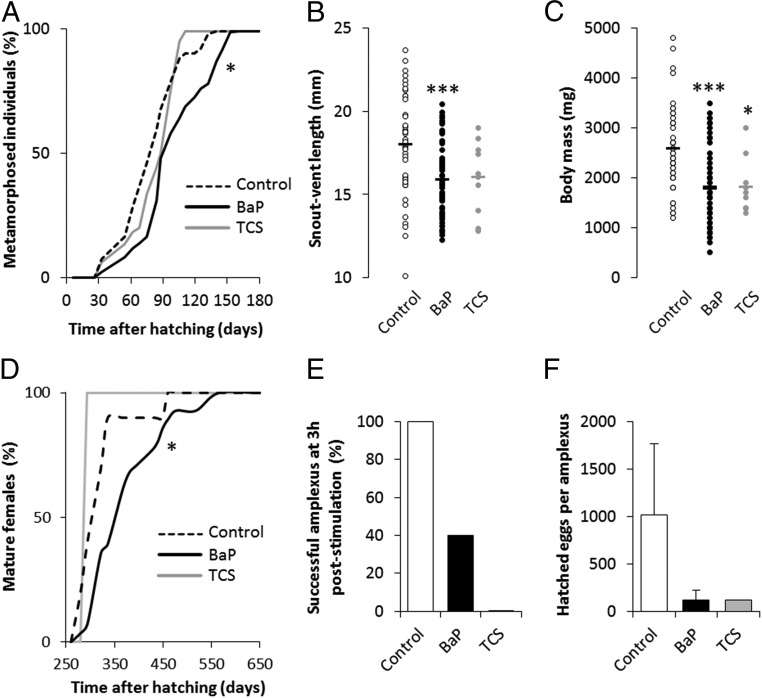
Fig. 4.
Parental exposure to EDs leads to delayed metamorphosis and reduced size and weight of progeny. (A) Development curves of F1 individuals from hatching to metamorphosis. The distributions of F1 individual development times were compared between the control and each parental ED-exposed population using a Kaplan–Meyer test to evaluate global curve difference. The asterisk indicates a significant difference from the control: *P < 0.05 (n = 716, 1,020, and 72 for control, BaP, and TCS parental exposure). (B) Snout-vent length of F1 individuals at time of metamorphosis from each parental exposure group. (C) Weight of F1 individuals at time of metamorphosis from each parental exposure group. The statistical analysis was performed using Dunnett’s test on log-transformed data. The asterisks indicate a significant difference from the control: *P < 0.05, ***P < 0.001 (n = 46, 63, and 10 for control, BaP, and TCS parental exposure, respectively). (D) Development curves of F1 juvenile females from hatching to sexual maturity. The distributions of F1 individual development times were compared between the control and each parental ED-exposed population using a Kaplan–Meyer test to evaluate global curve difference. The asterisk indicates a significant difference from the control: *P < 0.05 (n = 10, 28, and 1 for control, BaP, and TCS parental exposure). (E) Percentage of successful amplexus 3 h poststimulation of F1 animals (n = 5, 5, and 1 for the control, BaP, and TCS parental exposures, respectively). (F) Number of hatched eggs per F1 female from each successful amplexus (n = 5, 5, and 1 for the control, BaP, and TCS parental exposures, respectively).

