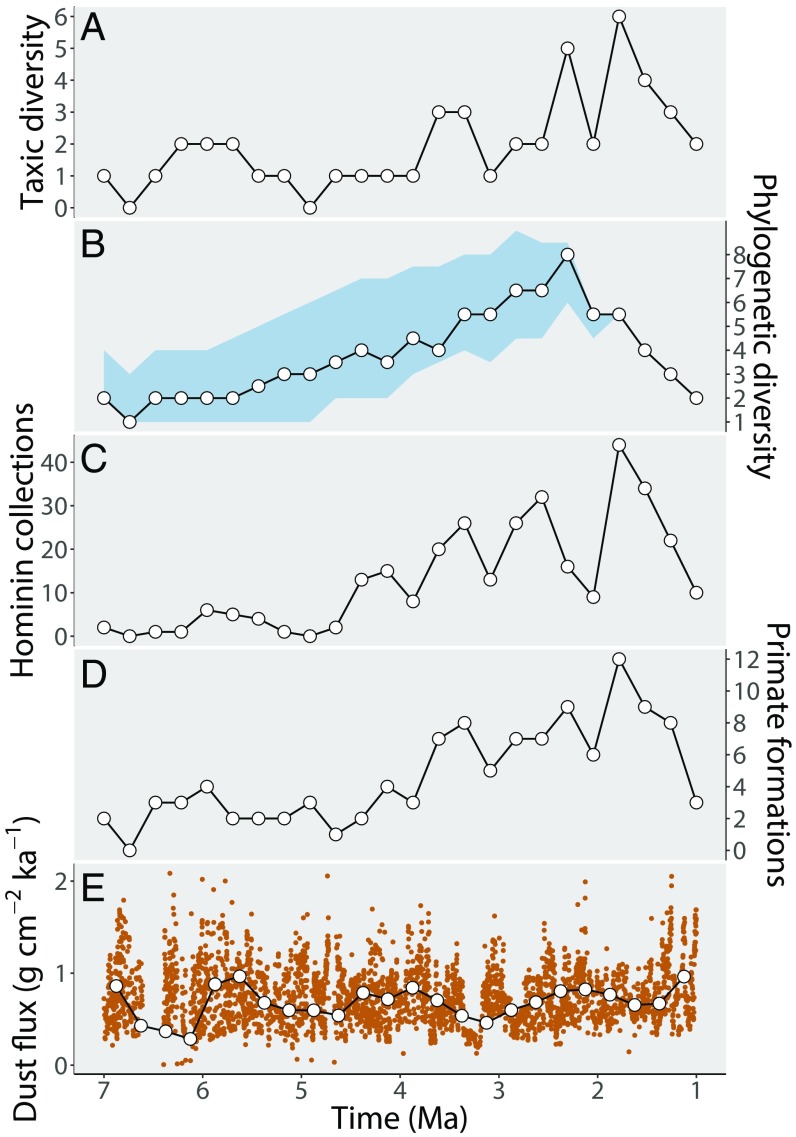
Fig. 1.
Early hominin diversity estimates, sampling metrics, and terrigenous dust flux through geological time. (A) Taxic diversity estimate (TDE). (B) Phylogenetic diversity estimate (PDE) based on the median of the four estimates shown in SI Appendix, Fig. S1. The blue envelopes represent upper and lower 95% CIs based on the median of 1,000 time-scaling replicates. (C) Hominin-bearing collections (HBCs). (D) Primate-bearing formations (PBFs). (E) Terrigenous dust flux curve (5). Original data appear in orange; interpolated means are shown in white circles with black outline. Data points are plotted at the midpoint age of each time bin.

