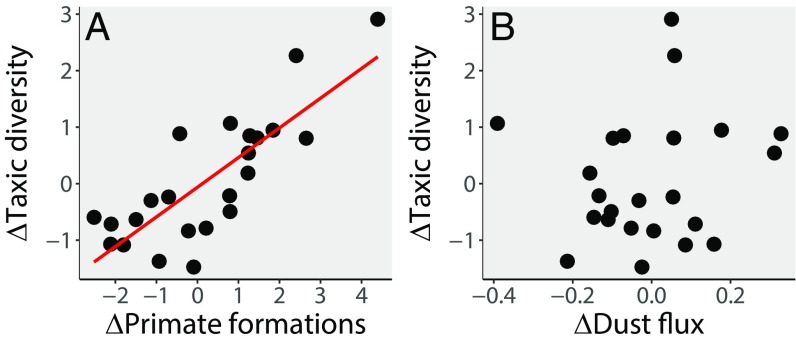
Fig. 2.
Scatter plots showing the relationship between early hominin taxic diversity and possible explanatory variables. ∆ indicates that the time series has undergone generalized differencing before statistical testing. (A) Taxic diversity estimate (TDE) against primate-bearing formations (PBFs). (B) TDE against aridity (5). See SI Appendix, Table S2 for correlation coefficients and P values.

