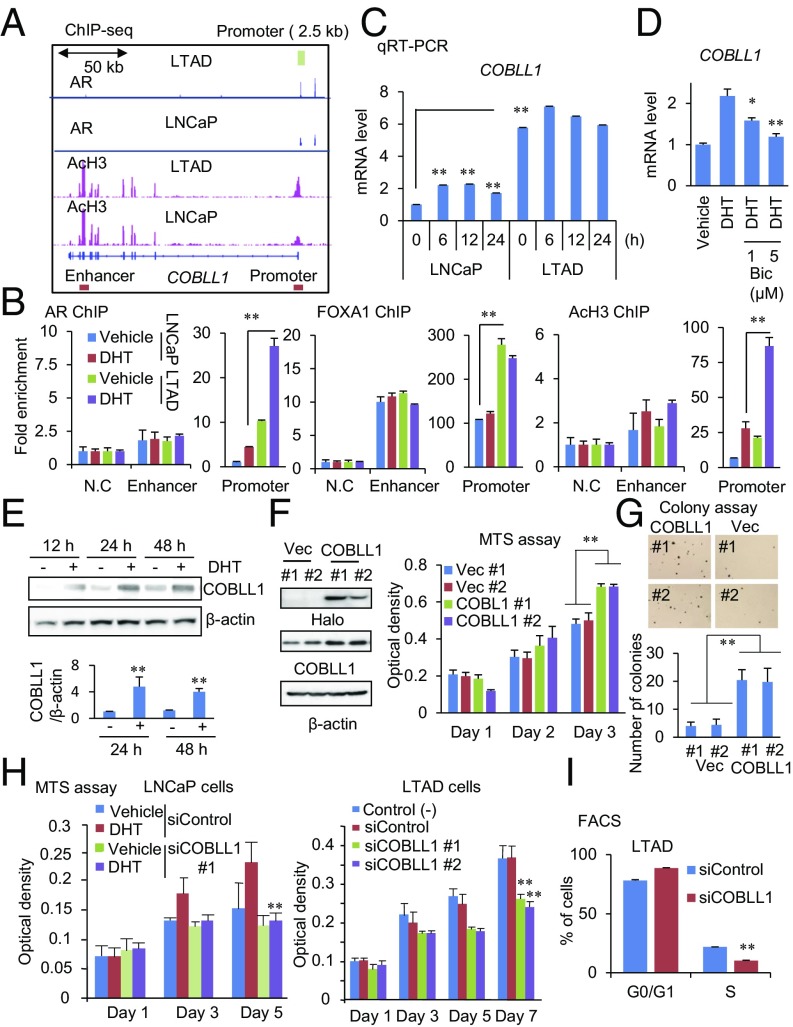
Fig. 2.
AR-regulated COBLL1 promotes CRPC cell growth. (A) Location of AR-binding sites in the COBLL1 locus. ChIP-seq analyses for AR and AcH3 were performed in LNCaP and LTAD cells. AR-binding promoter and enhancer regions (for ChIP) are shown by boxes. The AR promoter 2.5-kb sequence for luciferase assay is shown by a green box. (B) Enhancement of AR, FOXA1, and AcH3 in the AR-binding promoter region of COBLL1 in LTAD cells. Both LNCaP and LTAD cells were treated with 10 nM DHT or vehicle for 24 h. ChIP assays for AR, FOXA1, and AcH3 were performed. Fold enrichments of enhancer and promoter regions were quantified by qPCR (n = 3). N.C., negative control locus. (C) qRT-PCR analysis (n = 3) was performed to determine the expression level of COBLL1 in LNCaP and LTAD cells. Cells were treated with 10 nM DHT for the indicated time. (D) Androgen-mediated induction of COBLL1 is repressed by 1 or 5 μM bicalutamide (Bic). (E) Western blot analysis was performed to examine COBLL1 expression at the protein level in LNCaP cells treated with vehicle or 10 nM DHT. The intensities of COBLL1 bands relative to that of the corresponding β-actin band are shown (n = 3). (F, Left) LNCaP cells stably expressing Halo-COBLL1 or vector control were generated. (Right) The MTS assay was performed to analyze cell growth (n = 4). (G) LNCaP cells overexpressing COBLL1 or vector control (Vec) were plated in plates covered with soft agar. After 3-wk incubation, we counted the number of colonies per field (n = 5). (H) The MTS assay was performed in LNCaP (Left) and LTAD (Right) cells treated with siControl or siCOBLL1 #1 or #2. LNCaP cells were treated with 10 nM DHT or vehicle (n = 4). (I) FACS analysis was performed in LTAD cells treated with siControl or siCOBLL1 #1 for 72 h (n = 3). Values represent the mean ± SD. *P < 0.05; **P < 0.01.

