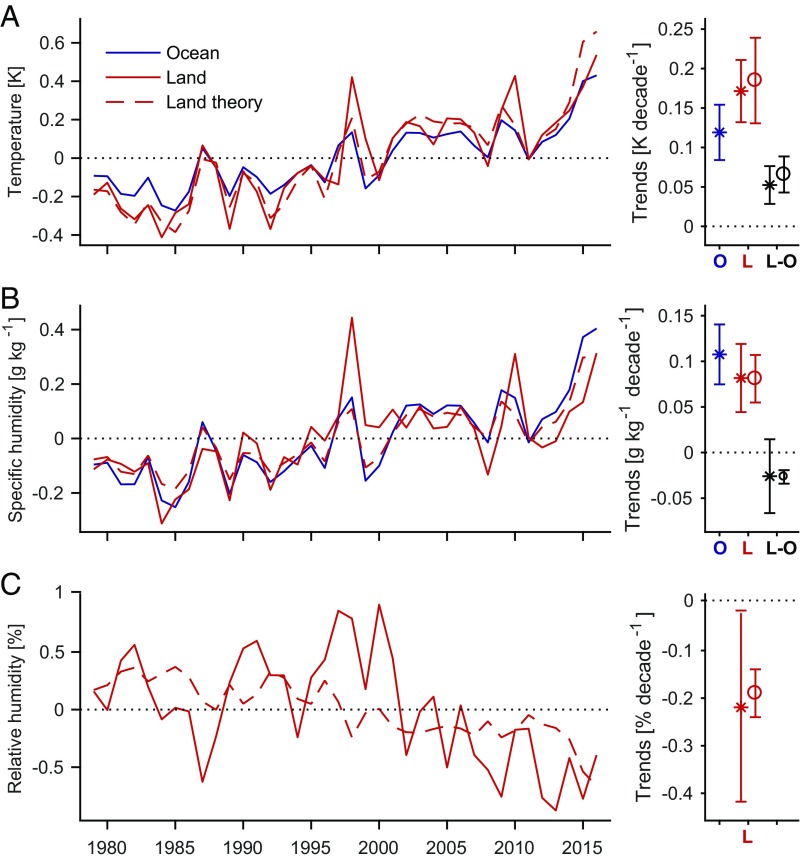
Fig. 1.
(A–C) Surface-air annual (A) temperature, (B) specific humidity, and (C) relative humidity anomalies averaged from S to N and best-fit trends (1979–2016) over land (red solid lines and asterisks) and ocean (blue lines and asterisks). The best-fit trends in the land–ocean contrasts in temperature and specific humidity ( and , respectively) are also plotted (black asterisks). Land values are from the HadISDH dataset (13, 14) and ocean values are from the ERA-Interim reanalysis (15). Ocean specific humidity anomalies are calculated assuming fixed climatological relative humidity (Materials and Methods). Also shown are land anomalies and associated trends (dashed lines and circles) estimated using the simple theory (Eqs. 2–4) and subsampled to the months and gridboxes for which HadISDH observations are available. Error bars on the trends indicate the 90% confidence intervals corrected to account for serial correlation (Materials and Methods).

