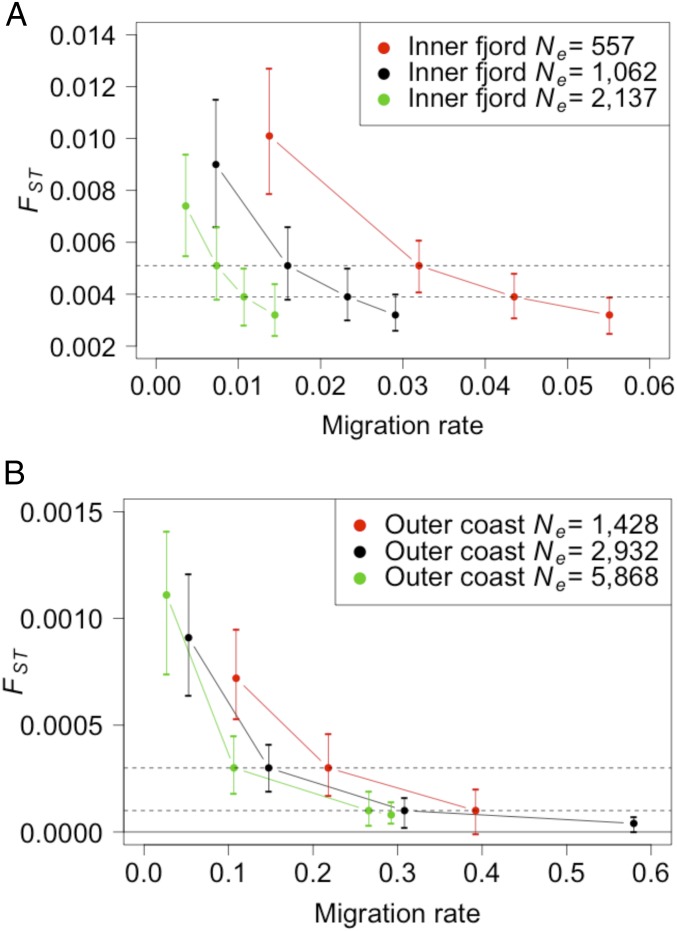
Fig. 2.
Visual representation of the mean (with 10% and 90% quantiles) levels of genetic differentiation, under different migration rates from the North Sea to the (A) inner fjord and (B) outer coast (data from SI Appendix, Table S1). Simulations used base case parameterization, with double and half the inner fjord and outer coast populations. The targeted empirical levels of genetic differentiation are shown as dotted horizontal lines, and zero is shown as a solid horizontal line in B. Response to migration is also shown at 25 and 100 migrants per year with the inner fjord (in A) and at 500 and 5,500 migrants per year with the outer coast, except for the smallest population size (in B), and translated into migration rate.

