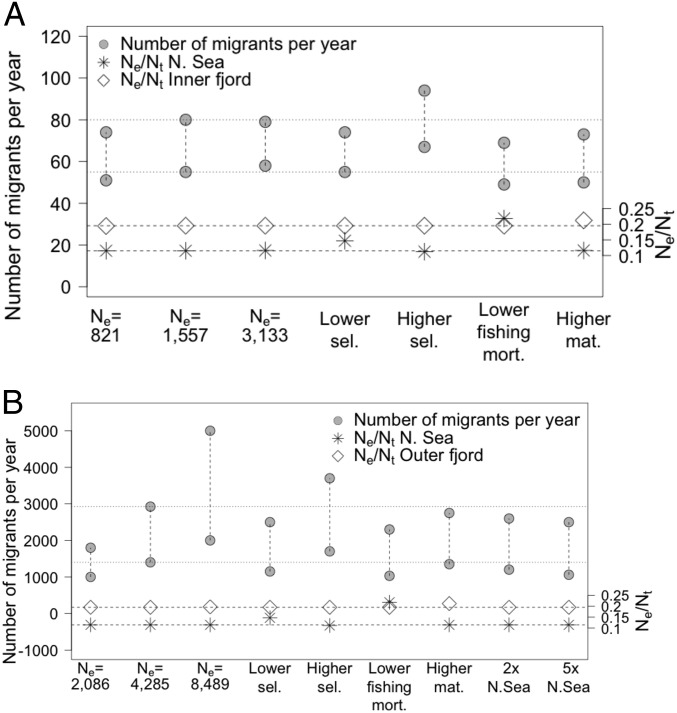
Fig. 3.
Sensitivity analyses of the estimated number of migrants between the simulated North Sea and the (A) inner fjord and (B) outer coast required to achieve empirical levels of genetic differentiation (Table 1). The first three sets of circles represent migration for half, equal, and double the estimated inner fjord (in A) and outer coast (in B) population sizes. Proceeding sets of circles indicate migration under lower and higher selectivity (sel.) applied to the North Sea, lower fishing mortality (mort.) in the North Sea, higher maturity (mat.) in the inner fjord and outer coasts, and higher North Sea population size (B only). Dotted lines represent base case migration for comparison. The Ne/Nt ratio is shown at the bottom of each plot; diamonds denote the Skagerrak and asterisks denote the North Sea. Dashed lines represent base case Ne/Nt values.

